
Quick Answer
For teams comparing GetDX alternatives, AndonPulse is relevant when the priority is delivery visibility across initiatives, earlier risk signals, root-cause investigation, realistic completion forecasting, and project-cost context. It does not replace a manager’s judgment. It gives the manager a connected route from a delivery warning to the work, dependency, or workflow stage that needs attention.
DX is a credible option for organizations that want developer intelligence, developer experience research, benchmarking, and measurement of AI-enabled software delivery. Its current product range includes developer experience, engineering productivity, AI measurement, allocation, and R&D capitalization capabilities, as described on the DX platform. Teams typically look for alternatives when the immediate question sits elsewhere: which initiative is likely to slip, where work is waiting, how to automate a review workflow, how engineering investment maps to business priorities, or how to prepare traceable capitalization reporting.
The right choice depends less on a feature checklist than on the decision your team needs to make repeatedly. Start with the management question, the data you trust, and the people who will use the answer.
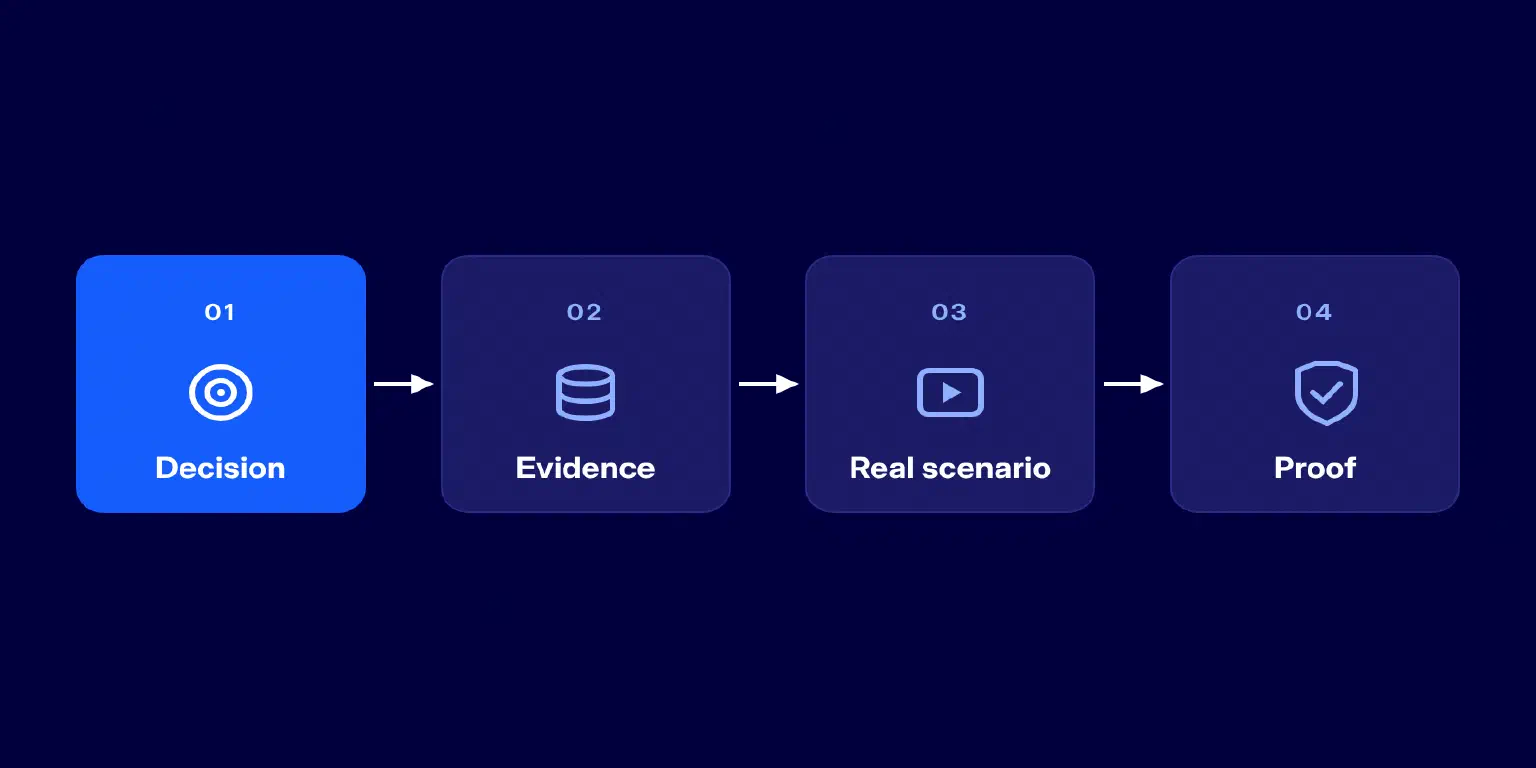
- Start with the decision that keeps recurring: developer friction, delivery risk, workflow bottlenecks, AI impact, allocation, or capitalization.
- Choose the evidence needed to answer it: surveys, code and pull-request telemetry, project data, finance data, AI-tool data, or a combination.
- Test the platform against one real scenario, rather than asking for a generic product tour.
- Confirm what can be configured, what requires a service engagement, and what is still only a sales claim.
Use the four-step path below to turn these criteria into a practical vendor evaluation.
Why Teams Look for a GetDX Alternative
Searching for a DX alternative does not mean that DX is failing. More often, an engineering organization has changed its operating question. A platform team may need to understand friction and developer sentiment. Six months later, the VP of Engineering may be trying to explain why an initiative is forecast to finish late. Those are related questions, but they are not identical.
The most common triggers fall into five groups:
1. The delivery question is becoming more urgent.
A team may already have good productivity reporting, yet still struggle to connect a change in cycle time to a particular initiative, dependency, or workflow stage. In that case, delivery visibility and root-cause depth matter more than adding another score.
2. The buyer needs a different measurement basis.
Some platforms are deliberately survey and research oriented. Others start with Git, pull request, issue-tracker, CI/CD, or financial data. The distinction affects what the product can explain. A developer survey can reveal friction that delivery telemetry cannot see. Conversely, system data can show where work is aging even when no survey has been run.
3. The organization wants action closer to the workflow.
If review queues or policy checks are a recurring constraint, a buyer may want more than a report that shows the issue. They may need workflow controls, alerts, or automation that helps a team test a change and measure whether it removed the constraint.
4. Finance has joined the conversation.
Resource allocation, project-cost context, and capitalization are not secondary concerns for companies that need to defend how R&D costs were assigned. In that situation, the question is not simply whether a tool displays engineering metrics. It is whether the underlying data model, reporting logic, and audit trail suit finance as well as engineering.
5. AI adoption needs evidence, not anecdotes.
Engineering leaders are increasingly asked whether coding assistants and agents are changing delivery outcomes. The answer requires more than seat counts. Buyers may need to examine adoption, cost, delivery flow, quality signals, and the baseline used for comparison. When AI measurement is central to the program, the vendor should make its attribution logic and assumptions visible.
These triggers can overlap. A CTO might need delivery forecasting, while Engineering Operations needs a credible metric model, and Finance needs traceability. The point is to identify the primary decision first, then test whether a platform can support the supporting decisions without turning the evaluation into a vague feature-count exercise.
Choose by Use Case, Not by Feature Count
A long capabilities list is not a buying model. Most serious engineering intelligence platforms connect several data sources and offer some mix of metrics, reporting, AI analysis, and integrations. A better question is: what should change after a leader opens the platform?
| Buyer question | Capability to evaluate | What good evidence looks like | Platforms to explore |
|---|---|---|---|
| Where is delivery risk forming across initiatives? | Portfolio visibility, risk signals, drill-down, forecast | An initiative can be traced to the task, stage, dependency, or team context behind the risk | AndonPulse, Jellyfish, Swarmia |
| Where do developers experience friction? | Surveys, qualitative research, workflow analysis | The platform combines developer feedback with actionable improvement areas | DX, Swarmia, Jellyfish |
| How can we reduce repetitive delivery friction? | Rules, alerts, workflow automation, review controls | The buyer can test a workflow trigger and see its operational effect | LinearB |
| Are AI tools changing delivery outcomes enough to justify spend? | AI adoption, usage, cost, delivery and quality context | The platform explains the baseline, data sources, and attribution assumptions | DX, Waydev, Axify, Swarmia, Jellyfish, AndonPulse |
| Where is engineering capacity invested? | Allocation, project context, investment reporting | Leaders can compare planned priorities with actual allocation | Jellyfish, DX, Swarmia, AndonPulse |
| Can we support finance and capitalization reporting? | Project-level effort evidence, rules, audit trail | Finance can review how activity was attributed and what assumptions were applied | DX, Swarmia, Jellyfish, Waydev, AndonPulse |
This framework also prevents a common procurement mistake: asking every vendor to demonstrate the same generic dashboard. Ask each vendor to answer a live question from your organization instead. For example, provide one initiative that is at risk, one team with an expanding review queue, and one finance report that took too long to prepare. When comparing DX alternatives, look for a clear route from raw data to a defensible management decision.
A practical measurement-basis map
The same term, “engineering intelligence,” can describe different data foundations. Use this map in demos:
| Data foundation | Questions it is strongest at | Questions it cannot answer alone |
|---|---|---|
| Developer surveys and research | Friction, satisfaction, perceived barriers, enablement needs | Which task or dependency caused a current delivery delay |
| Code, pull request, and CI/CD telemetry | Flow, review queues, deployment patterns, engineering workflow | Why a business priority changed or whether a project should be re-scoped |
| Issue and project data | Scope, work-item age, initiatives, dependencies, project progress | Whether developers are satisfied with the workflow |
| HR, allocation, and finance data | Capacity, project cost, capitalization, organizational context | The detailed technical reason a pull request is waiting |
| AI-tool usage and spend data | Adoption, cost, usage patterns, possible delivery impact | Whether a correlation represents causation without a sound baseline |
A reliable decision rarely comes from one data source alone. The diagram below shows how surveys, code and CI/CD, project data, finance data, and AI-tool data can be combined around the decision the buyer needs to make.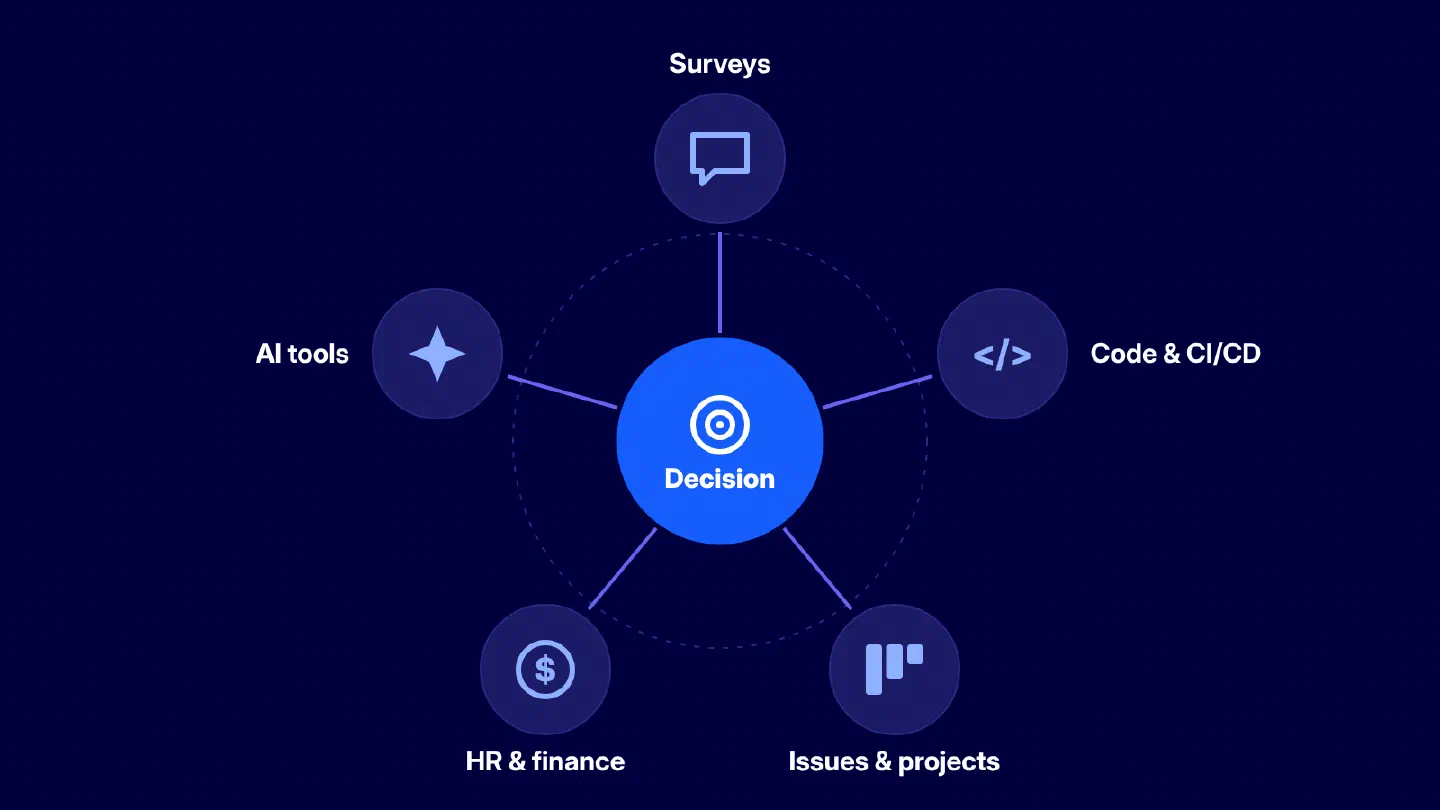
No single row is inherently better. The useful platform is the one that combines the sources needed for the buyer’s decision and makes its assumptions inspectable.
GetDX Alternatives at a Glance
The table below is a research starting point, not a product ranking. It reflects public positioning reviewed on October 16, 2026. It lists alternatives rather than repeating DX. A blank or “confirm in demo” entry means a buyer should verify the exact workflow, deployment option, or report before treating it as a requirement.
| Platform | Best starting point | Publicly positioned strengths | Ask in a demo |
|---|---|---|---|
| AndonPulse | Delivery risk and initiative visibility | Connected delivery model, risk signals, root-cause drill-down, forecasting, project-cost context, capitalization | Can we follow one at-risk initiative from portfolio view to the work and dependency behind it? |
| Swarmia | Broad engineering intelligence | Engineering metrics, AI adoption and cost, initiatives, investment balance, capitalization, DevEx surveys | Which views are available out of the box and which require configuration? |
| Jellyfish | Engineering management and business alignment | Operational effectiveness, allocation, DevEx, AI impact, and DevFinOps | How do resource allocation and delivery context appear in the same review? |
| LinearB | Workflow automation and delivery flow | Productivity insight, workflow automation, AI code review, DevEx, executive reporting | Which rules can be configured and how is their effect measured? |
| Waydev | AI measurement and ROI | AI adoption, impact, ROI and spend with DORA, SPACE, DX, and delivery metrics | What baseline and attribution logic are used for AI impact? |
| Axify | AI-augmented engineering teams | AI adoption, tool usage, productivity impact, DORA, value-stream and developer-productivity views | Which recommendations are generated from our connected data and how can we audit them? |
| Tempo | Strategic portfolio management and AI spend | AI cost attribution, capacity planning, and portfolio orchestration | How does AI spend connect to Jira work and portfolio outcomes? |
The comparison is intentionally not a list of checkmarks. Feature names age quickly, and similar labels can hide different measurement logic. Several platforms in this table address delivery predictability in some form, but one may forecast at a project level while another focuses on capacity scenarios or code-delivery patterns. Ask to see the forecast assumptions, the data refresh behavior, and the point at which a manager can challenge the model.
Which Platforms Fit Which Scenario?
1. When developer experience and research come first
DX is a natural platform to evaluate when the organization wants a research-led developer intelligence program. Its public product navigation includes developer experience, developer experience index, industry benchmarking, workflow analysis, targeted studies, experience sampling, and developer satisfaction alongside engineering productivity. That combination matters when a leadership team needs to learn not only where flow is slow, but also how developers experience the systems and practices around them.
This is the right category to explore when you need a repeatable way to collect feedback, prioritize friction, and connect the findings to an engineering-improvement program. It is less useful to ask whether DX is “better” than a delivery-risk platform. The meaningful comparison is whether your first question is about developer experience or about a particular initiative that needs intervention this week.
Swarmia is also relevant in this scenario because it publicly offers developer experience surveys alongside engineering metrics, investment balance, initiatives, AI adoption and cost, and capitalization. A buyer with both DevEx and delivery needs should ask how survey findings relate to operational data and whether leaders can separate a team-health concern from a project-risk concern.
2. When delivery risk, portfolio health, and forecasting come first
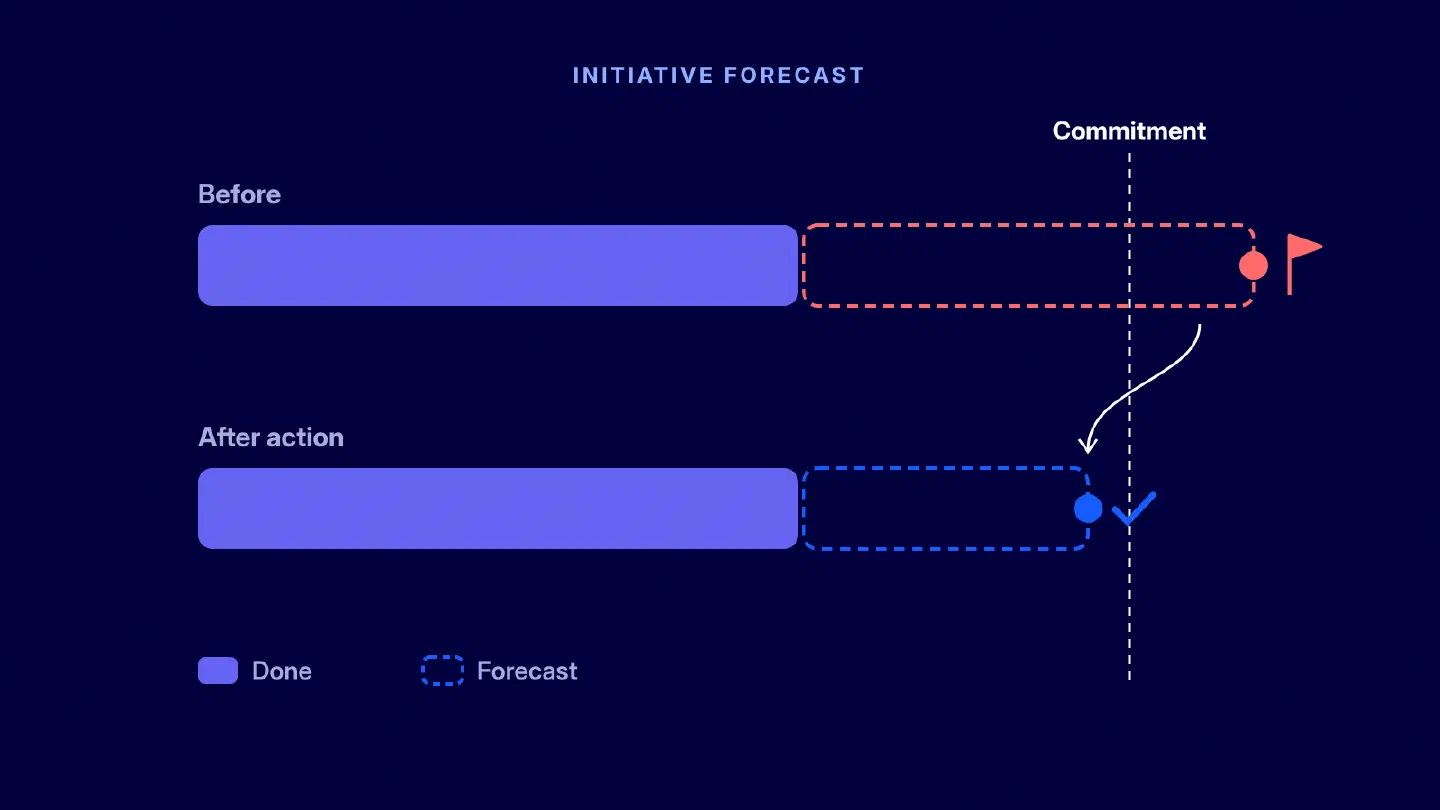
This is the category for a delivery leader who needs to know which initiative is slipping before the status meeting. AndonPulse engineering delivery analytics is designed around that workflow: connect the tools teams already use, create a live view of initiatives, flag delivery risks from work data, and let a manager drill from an initiative to its epic, project, task, workflow stage, dependency, team, or contributor context. It then updates the forecast after a management action such as reassigning work, unblocking a dependency, or re-scoping the initiative.
That is a distinct use case from measuring individual activity. The management question is: what is affecting the delivery commitment, and what evidence supports the next intervention? AndonPulse should be on the shortlist when that route from warning to root cause is more important than a generic productivity score.
Jellyfish and Swarmia also warrant a conversation if the buyer needs delivery context alongside business alignment, allocation, or broader engineering reporting. Jellyfish’s public platform groups operational effectiveness, business alignment, DevEx, AI impact, and DevFinOps. Swarmia highlights cross-team initiatives, investment balance, and engineering metrics. The demo should determine whether their delivery view fits the operating cadence of the organization and how much configuration is required for its project model.
3. When workflow automation is the primary lever
Some teams do not need another report telling them that review time is rising. They need to change the workflow around reviews, approvals, routing, testing, or policy enforcement. LinearB is a sensible option in this category because its public product messaging emphasizes metrics plus automation. Its programmable workflows are positioned to automate review-related tasks, enforce policies, and apply rules across repositories.
The important test is closed-loop evidence. A vendor should show not only how a workflow rule is created, but also how a team can see whether it shortened waiting time, shifted bottlenecks elsewhere, or introduced noise. Automation without an operational feedback loop can simply make an existing process faster in the wrong direction.
4. When AI impact and AI spend need to be measured
Waydev, Axify, DX, Swarmia, and Jellyfish now publicly address AI measurement in different ways. AndonPulse also belongs in this group: its AI metrics cover adoption, usage, cost, and impact, with those signals analyzed alongside delivery outcomes. This lets teams compare AI adoption with changes in cycle time, throughput, review demand, and quality rather than treating usage alone as proof of productivity. Waydev is particularly explicit about connecting AI adoption, impact, ROI, and spend to engineering data. Axify focuses on adoption visibility, actual tool usage, and productivity impact for AI-augmented teams. DX frames AI measurement within its broader engineering-intelligence platform. The relevant buyer question is not whether a platform has an AI dashboard. It is whether the organization agrees with the baseline, comparison window, cost inputs, and outcome measures used to interpret the dashboard.
Ask for a demonstration using a team that adopted an AI tool at a known point in time. Then ask how the platform handles changing work mix, staffing, seasonality, incidents, and an increase in review volume. Without that context, an apparent improvement in throughput may not be attributable to the tool at all.
5. When finance and capitalization need the same data model
Finance-led evaluations need more than a project tag and a time export. The buyer should be able to trace the source activity, see the policy or allocation rule applied, review exceptions, and understand what the report does not decide. DX, Swarmia, Jellyfish, Waydev, and AndonPulse all publicly position products around finance, allocation, or capitalization-related use cases. Their specific approach, jurisdictional fit, deployment model, and audit workflow should be confirmed with finance and accounting advisers.
For a buyer whose immediate need is delivery risk plus project-cost context, AndonPulse offers a different angle: the delivery model used for initiative health and forecasting can also provide transparent project effort and R&D capitalization reporting. It is not legal or accounting advice, and final eligibility decisions remain with the company and its advisers. That boundary is valuable, because an engineering platform should preserve evidence rather than replace policy judgment.
Where AndonPulse Fits
AndonPulse fits best when the organization needs to manage software delivery across more than one team and needs a clearer path from an executive signal to the work behind it. The product does not ask engineers to create a separate reporting workflow. According to the public product overview, teams connect their existing stack, AndonPulse builds a live model of initiatives, epics, projects, and tasks, and risks rise to the top when delivery begins to drift.
The useful distinction is the depth of investigation. A portfolio view can tell a leader that an initiative is at risk. The next screen should show why: a task with no progress, work stuck in review, an overdue dependency, or a workflow stage where elapsed time is accumulating. A manager can then decide whether to change ownership, remove a blocker, move capacity, or re-scope. AndonPulse does not decide for the manager. It makes the evidence and forecast easier to inspect before the decision is made.
Another strong fit is AI measurement tied to actual delivery. AndonPulse brings adoption, usage, cost, and impact metrics into the same context as cycle time, throughput, review demand, and quality, helping leaders distinguish broad tool adoption from measurable operational change.
AndonPulse is especially relevant when a company has existing Jira, GitHub, GitLab, Linear, or related delivery data but spends too much time stitching it into status reports. Review AndonPulse integrations with the actual tool stack in hand. Do not assume that a listed integration answers every question about sync direction, historical backfill, refresh timing, or custom configuration.
How to Evaluate the Final Vendors
Once the longlist is down to a few candidates, use a weighted scorecard. The weights should reflect the buying decision, not the vendor’s strongest slide. A platform team may give DevEx and integration depth the highest weight. A delivery organization may weight forecasting and root-cause investigation. Finance may weight evidence, allocation logic, and reporting controls.
| Evaluation criterion | What to test | Suggested weight if delivery is the priority |
|---|---|---|
| Measurement basis | Which systems feed the model, what data is missing, and how definitions are documented | 10% |
| Delivery context | Can the platform connect metrics to initiatives, scope, dependencies, and ownership? | 15% |
| Forecasting | Does it show assumptions, uncertainty, and how new progress changes the view? | 12% |
| Root-cause depth | Can a leader move from risk to work item and workflow context without manual reporting? | 15% |
| DevEx | Can teams collect and use developer feedback without turning it into individual surveillance? | 8% |
| AI measurement | Are adoption, cost, outcome measures, and baselines transparent? | 8% |
| Workflow automation | Can the platform support a tested operational change, not only report a metric? | 8% |
| Finance and capitalization | Is effort traceable by initiative, and can finance review the applied rules? | 10% |
| Integrations and configuration | Does the product reflect your workflows, structures, and definitions? | 8% |
| Governance, security, and implementation | Can the buyer validate RBAC, data handling, rollout effort, and support? | 6% |
The visualization below shows how the same criteria can be weighted when delivery is the primary buying priority.
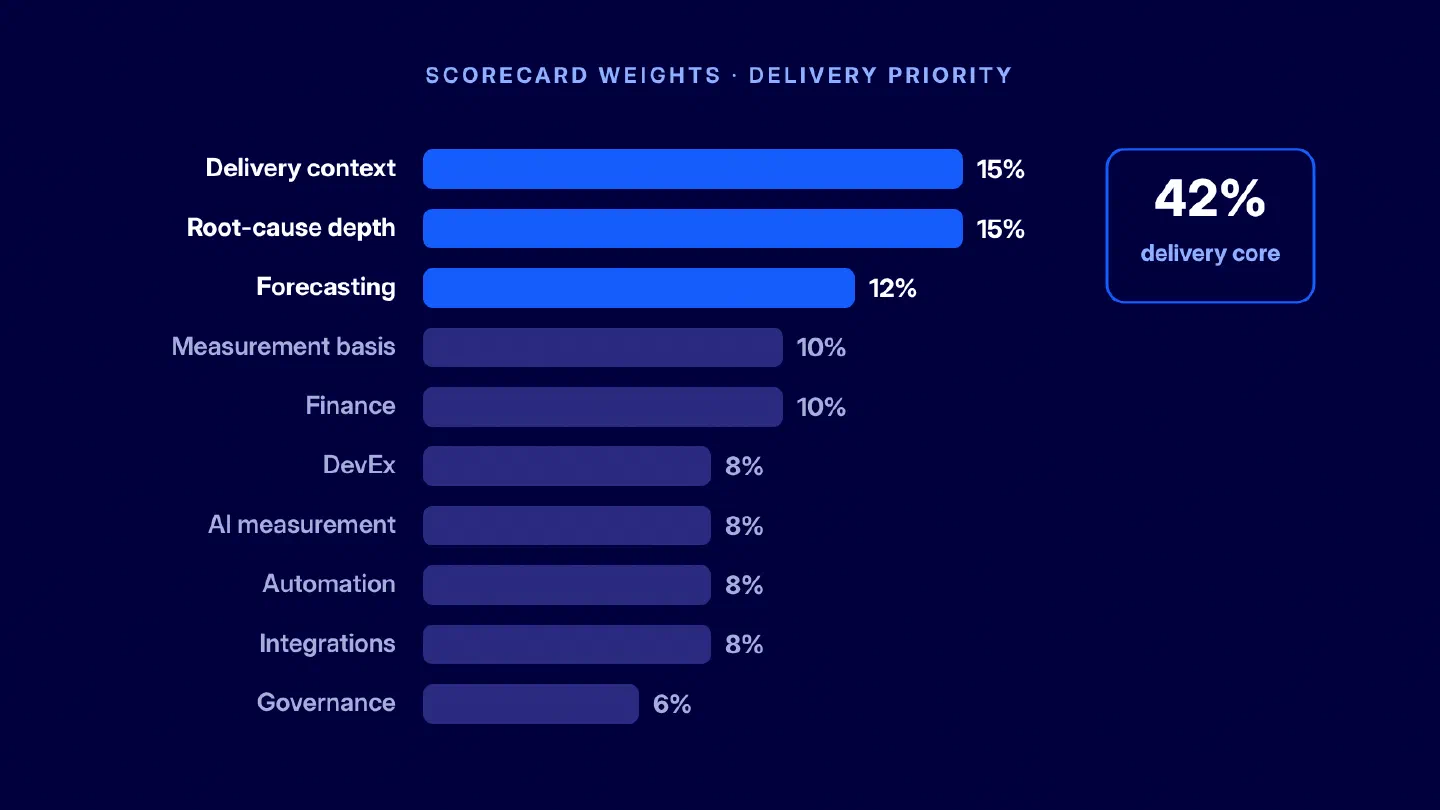
In this example, delivery context, root-cause depth, and forecasting account for 42% of the total score.
Score each item from one to five after the demo. Write down the evidence used for the score. A score of five without a concrete demonstration is not evidence; it is a sales impression. If a capability is important but not demonstrated, mark it “needs proof” rather than treating it as a failure or a pass.
What to Verify in Every Demo
Use the same questions for every finalist. It keeps the comparison fair and makes gaps visible quickly.
Data and measurement
- Data sources and history. Which project, code, CI/CD, HR, finance, and AI-tool sources can connect? What is read-only, what can be written back, and how much historical data is available?
- Metric definitions. How are cycle time, throughput, allocation, AI impact, and other central measures defined? Can we adjust definitions to match our workflow without losing comparability?
- Forecast assumptions. What inputs affect a forecast? How are scope changes, blockers, dependencies, and work that is already aging treated?
- Individual-data boundaries. What can managers see at contributor level? Which aggregation thresholds, permissions, and privacy controls are available? Do not treat an engineering analytics platform as a ranking tool.
Operational fit and governance
- Root-cause route. Ask the vendor to start with one at-risk initiative and identify the work, stage, dependency, or queue contributing to the risk.
- Automation and action. If the platform recommends or enables a workflow change, how can the team test whether it helped instead of shifting the problem?
- Reporting and exports. Can the organization export the evidence needed for leadership, finance, audit, and its own analysis without recreating the report in a spreadsheet?
- Security and operating model. Verify RBAC, deployment options, data retention, integration refresh, implementation effort, support, and total cost with current documentation and contract terms.
Final Takeaway
The best GetDX alternatives are not necessarily the platforms with the longest feature list. They are the platforms that make the organization’s most important engineering decisions easier to defend. Decide whether the priority is developer experience, delivery risk, workflow automation, AI impact, investment visibility, or finance. Then ask each finalist to answer one real question from your organization using your own data and workflow.
For organizations that need to see delivery risk across initiatives, investigate the reason behind a warning, and work with a forecast grounded in current progress, AndonPulse belongs on the final shortlist. It connects planning and engineering data in one delivery model, so leaders can move from a portfolio-level signal to the work, workflow stage, or dependency that requires attention.
FAQ
What are the best GetDX alternatives?
Who are GetDX competitors?
Is a DX alternative better for delivery forecasting?
How should we compare DX alternatives for developer experience?
Can engineering intelligence platforms measure AI impact?
Which platforms support software capitalization?
How long does implementation take?
Should we switch platforms or run a proof of concept first?
See AndonPulse in Your Own Delivery Data
A platform comparison is most useful when it is tested against a real delivery question. Bring one live initiative with a delivery commitment, recent work, and at least one dependency to a guided AndonPulse demo. You can see how the platform connects planning and engineering data, surfaces delivery risk, and lets a manager trace a portfolio-level signal to the work behind it.
See the full picture behind your next delivery commitment. In a guided demo, explore how AndonPulse brings progress, bottlenecks, and forecast changes into one view.