
Most engineering leaders don’t start with an abstract question about productivity. They get there because something in delivery needs explaining: a release is late, review queues are building up, or a strategic initiative is using more capacity than expected. The dashboard may show plenty of activity and still not explain the decision in front of them. Commit volume can rise while release work waits in review. A healthy ticket-closure rate can sit beside a backlog of defects.
That is where anyone working out how to measure developer productivity should begin. The useful answer is a small group of measures read together, not an individual score dressed up as an operational metric. This guide explains how to measure developer productivity through flow, quality, developer experience, and business context. It also requires a local baseline and an investigation before a target is set. The test is simple: can the evidence help a manager choose what to do next?
Quick Answer for Engineering Leaders
- Begin with the decision that is pending, not with a favorite framework or dashboard.
- Use two to four measures that show the outcome alongside the likely constraint.
- Keep the unit of analysis at team, product, service, value stream, or initiative level.
- Put the team’s own history ahead of any market benchmark.
- When a result moves, investigate the cause and then measure the effect of the change.
Developer productivity is about whether a team or delivery system can turn engineering effort and knowledge into useful, reliable software.
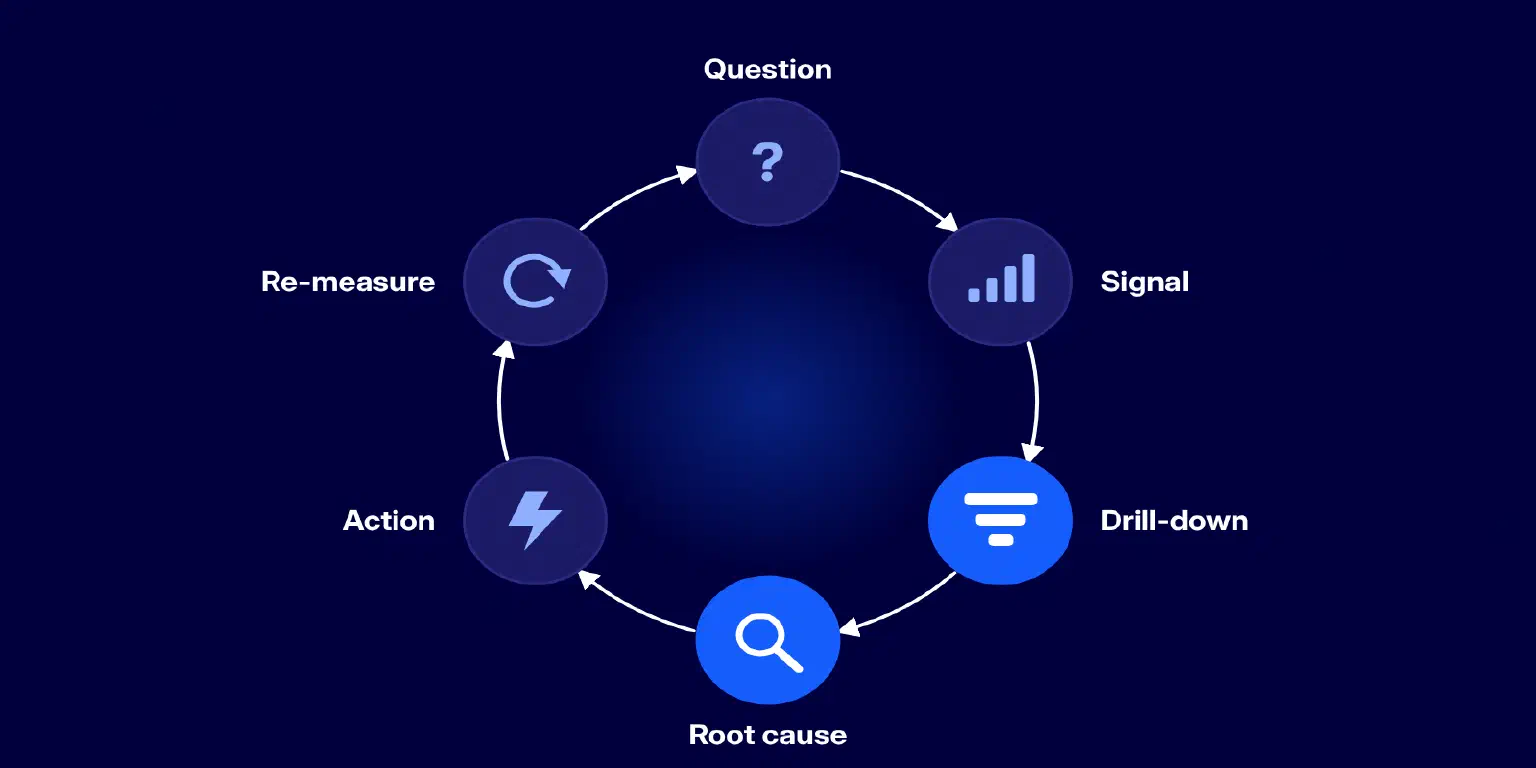
Figure 1 shows a practical feedback loop for turning a management question into an informed action. It begins with the question the team needs to answer, uses a metric as the initial signal, and then moves through drill-down, root-cause analysis, action, and re-measurement.
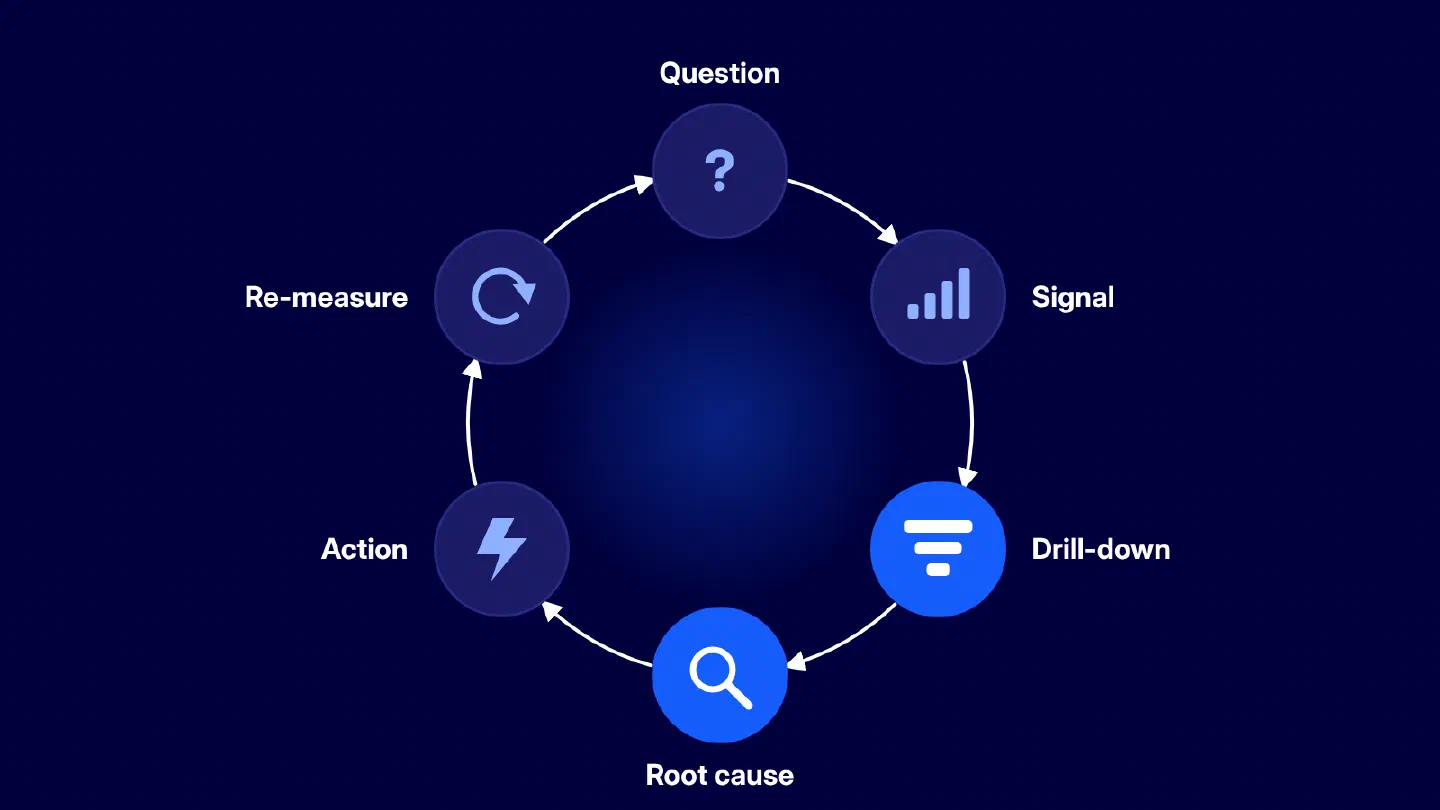
Each step answers a different management need. The signal shows that performance changed; drill-down and root-cause analysis explain why; action addresses the constraint; and re-measurement shows whether the intervention improved delivery. Because the loop returns to the original question, measurement stays tied to a decision instead of becoming a collection of disconnected metrics.
AndonPulse engineering delivery analytics follows the same logic. A metric is useful when a leader can trace it to the initiative, workflow stage, dependency, project, or resource context that produced it. The platform supplies evidence for the investigation. It doesn’t make the operating decision for management.
How to Measure Developer Productivity
1. Start With the Management Question
Before selecting a metric, write down the decision that needs evidence. DORA’s measurement guidance recommends the same order: decide why the measurement is needed and which decision or change it should inform, then select the framework and source. Otherwise, teams tend to collect whatever is available and look for a use for it later.
| If you need to know | Start with | Then investigate |
|---|---|---|
| Why is delivery slowing? | Cycle time and blocked time | Stage time, WIP, work item age, and dependency waits, blocker category, and blocked duration |
| Is code review the bottleneck? | Review time | Queue size, reviewer load, pull request size, and ownership |
| Are teams starting too much work? | WIP | Aging work, blocked work, throughput, and priority changes |
| Are we shipping faster but breaking more? | Deployment frequency | Change failure rate, rework, incidents, and recovery time |
| Did AI improve delivery? | Cycle time and throughput | Review demand, quality, developer experience, and cost |
| Where is capacity going? | Allocation by initiative | Roadmap priority versus actual investment and unplanned work |
| Will this initiative finish on time? | Initiative progress and flow | Dependencies, aging work, scope movement, and forecast variance |
The management question comes first. The initial signal comes next. The third column shows what needs checking before anyone recommends an intervention. For several teams measuring engineering productivity, that sequence is more useful than one target applied everywhere. AndonPulse links portfolio and initiative context with workflow evidence from the organization’s engineering integrations, without creating another reporting task for engineers.
2. Choose the Right Measurement Method
No framework gives a leadership team a complete measurement system. Each one highlights a different part of delivery. The right choice depends on the decision currently on the table.
Choose DORA when you need to understand:
- delivery speed;
- release reliability;
- recovery after a failure.
Choose flow metrics when you need to diagnose:
- queues and waiting;
- work in progress;
- aging work;
- a slow workflow stage.
Add DevEx when system data cannot explain why performance changed. The DevEx research published by Communications of the ACM focuses attention on feedback loops, cognitive load, and flow state, the three core dimensions of day-to-day development work.
Use SPACE when you are designing the overall measurement system. The SPACE framework from Microsoft Research explains why no single dimension can represent developer productivity. It helps teams balance satisfaction and well-being, performance, activity, communication and collaboration, and efficiency and flow.
A working measurement stack normally has four layers:
- Flow: How quickly and predictably does work move?
- Quality and reliability: Does faster delivery create failures, rework, or operational risk?
- Developer experience: What friction or cognitive load is affecting the system?
- Business context: Is capacity supporting the initiatives and outcomes leadership selected?
Together, the four layers keep engineering productivity measurement connected to an operating decision. DORA and flow data show what moved in delivery. DevEx can explain the friction behind the number. Business context tells leadership whether the change is material enough to act on.
3. Track the Core Developer Productivity Metrics
Treat software engineering productivity metrics as diagnostic instruments. They belong at the team, product, service, value-stream, or initiative level, not in an individual score. A metric is ready for use when people can reproduce its formula, read a change consistently, and name the next investigation.
The Kanban Guide identifies work in progress, throughput, work item age, and cycle time as the minimum flow measures. Stage time adds the detail needed to locate a queue. Change failure rate protects against treating speed as the only outcome. Forecast variance connects delivery behavior to a commitment leadership understands.
| Metric | Practical formula | What it tells you and what to do next |
|---|---|---|
| Cycle time | Finish time - start time | Shows total elapsed time. Segment it by workflow stage when it changes materially |
| Blocked time | Sum of explicit blocked periods | Shows how much elapsed delivery time is attributable to known blockers. Break it down by cause, workflow stage, and dependency before acting. |
| Stage time | Stage exit - stage entry | Locates delay in coding, review, test, deployment, or another defined stage |
| Work in progress | Items started but not finished at time t | Shows how much open work is competing for attention. Inspect limits, queues, and blocked items |
| Throughput | Completed items / period | Shows delivery rate for a defined work type. Review work mix before interpreting a change |
| Work item age | Current time - start time | Identifies unfinished work at risk. Inspect the oldest items and their blockers |
| Change failure rate | Failed production changes / total production changes x 100% | Shows the share of changes that require remediation or cause degraded service |
| Forecast variance | Actual completion date - committed date | Shows delivery predictability while keeping scope changes and re-baselining visible |
Advanced Metrics You May Also Need
- Deployment frequency: production deployments per period. Compare services only when their release models are similar.
- Recovery time: service restoration time minus incident start time. Keep incident severity and clock rules consistent.
- Rework rate: corrective work divided by total completed work. Use it to see how much capacity returns to defects or avoidable correction.
- Flow efficiency: active work time divided by total cycle time. It estimates how much elapsed time is active work rather than waiting.
- Allocation variance: actual allocation percentage minus planned allocation percentage. It shows whether capacity followed investment intent.
- Initiative progress: completed defined scope divided by current defined scope. Review it with scope growth, aging work, and dependencies.
Use these developer productivity metrics to cut reporting noise, not create another layer of it. Whoever owns a measure should be able to explain three things: the question it answers, the change that deserves a closer look, and the decision management can make. A short list of software developer productivity metrics is enough when every item does that work. If it can’t, it doesn’t need to be on the main scorecard.
Practical rule: if a metric changes but nobody knows what question to investigate next, it is probably not ready for the executive dashboard.
4. Diagnose the Metric Before You Act
Picture a product team whose median cycle time has moved from 6.2 to 9.1 days over four weeks. That’s 47%. It matters, but it isn’t proof that the developers have become less effective.
| Signal | Baseline | Current period | Change |
|---|---|---|---|
| Median cycle time | 6.2 days | 9.1 days | +47% |
| Median coding time | 2.4 days | 2.4 days | No change |
| Median review time | 1.1 days | 3.8 days | +245% |
| Review WIP | 7 items | 19 items | +171% |
| Change failure rate | 5% | 5% | No change |
The breakdown below makes the bottleneck visible: coding time is unchanged, while review time has increased from 1.1 to 3.8 days.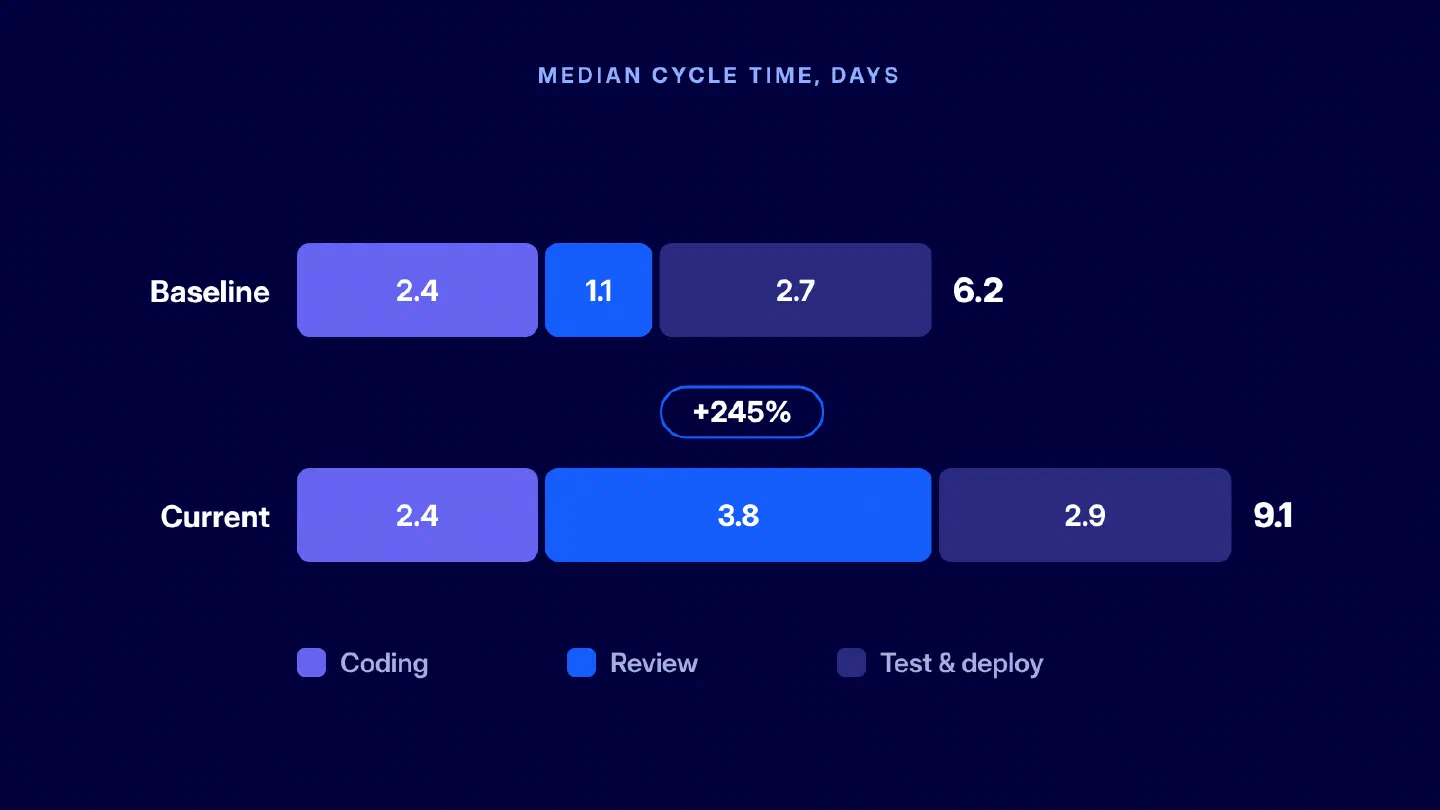
What Changed
- Median review time increased by 245%.
- Review WIP increased by 171%.
- Total cycle time increased by 47%.
What Did Not Change
- Coding time remained at 2.4 days.
- Change failure rate remained at 5%.
What the Evidence Suggests
Check blocked time before attributing the increase to slower execution. If blocked time rose with cycle time while coding time stayed stable, investigate dependencies, approvals, and other explicit blockers. If blocked time stayed flat while review time rose, focus on queue size and reviewer capacity instead. Coding hasn’t taken longer. The backlog is in review, where the queue has almost tripled. Get specific: are the right reviewers available, is ownership clear, has pull-request size changed, and is another initiative drawing on the same people? If two senior reviewers moved to an urgent migration, management can redistribute ownership, set a review WIP limit, add coverage, or split oversized changes. Telling the team to close more tickets won’t resolve the constraint.
The sequence is plain: see the change, separate the data, find evidence for the cause, act, and check the result. For teams measuring software engineering productivity, that is sounder than treating a 47% change as a performance verdict.
How This Investigation Works in AndonPulse
An initiative can start missing its expected pace for several reasons, and a portfolio-level metric alone does not tell a leader which one applies. The dashboard is useful when it makes the next question easier to answer. AndonPulse brings at-risk initiatives to the top of a live cross-team view and shows why they need attention, such as stalled progress, work stuck in review, or an overdue task.
- Open the flagged initiative. For a leader measuring software engineering productivity, the investigation starts with the flagged initiative and its forecast against the committed deadline. From there, the leader can move into the related epic, project, and task instead of collecting manual status updates from several teams.
- Find the stage where time builds up. The workflow phases show where elapsed time is building up. Coding time may be stable while review time is growing. Opening the affected work items adds the missing context: what is aging, what is blocked, and which owner, team, or dependency is involved.
- Act and re-check the forecast. With that evidence, the manager can decide whether to reassign work, remove a blocker, or re-scope the initiative. The refreshed forecast and the same delivery signals then show whether the risk is reducing after the change.
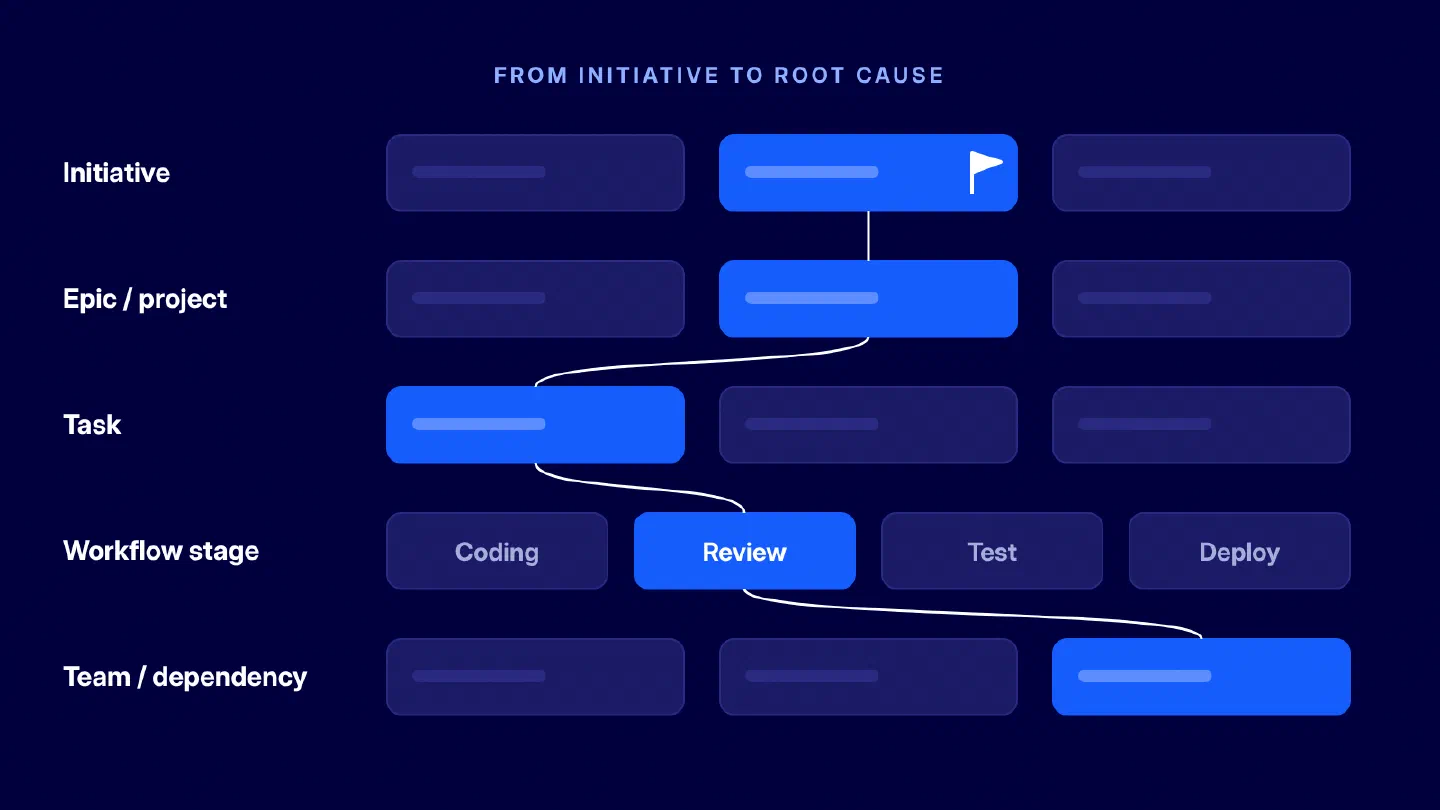
The practical value is that the portfolio view, delivery evidence, and next management action stay connected. AndonPulse does not make the decision for the manager. It removes the manual chase for status and gives the manager current evidence before a delay turns into a missed commitment.
5. Interpret the Metric Before Setting a Target
An easy-to-display number isn’t automatically a useful target. Teams measuring developer productivity usually learn more from their own operating history, as long as the definitions stay stable and the work is comparable. External figures can help later. They’re not the place to begin.
5.1 Build a Local Baseline
- Choose the period. Use enough observations to capture the normal delivery rhythm. Exclude or label release freezes, major incidents, holidays, and migrations.
- Segment the work. Separate features, bugs, platform work, incidents, and other work types that move under different constraints.
- Read the distribution. Report the median for the typical result and P75 or P85 for the slower tail. Keep the sample size beside them.
- Document exceptions. Record reorganizations, staffing changes, scope changes, and other events that affect comparability.
A baseline is a record of normal operating conditions before something changes. It isn’t a goal. When measuring developer productivity, it gives the team the context needed to understand what a later result actually means.
5.2 Use Median and Percentiles, Not Just Averages
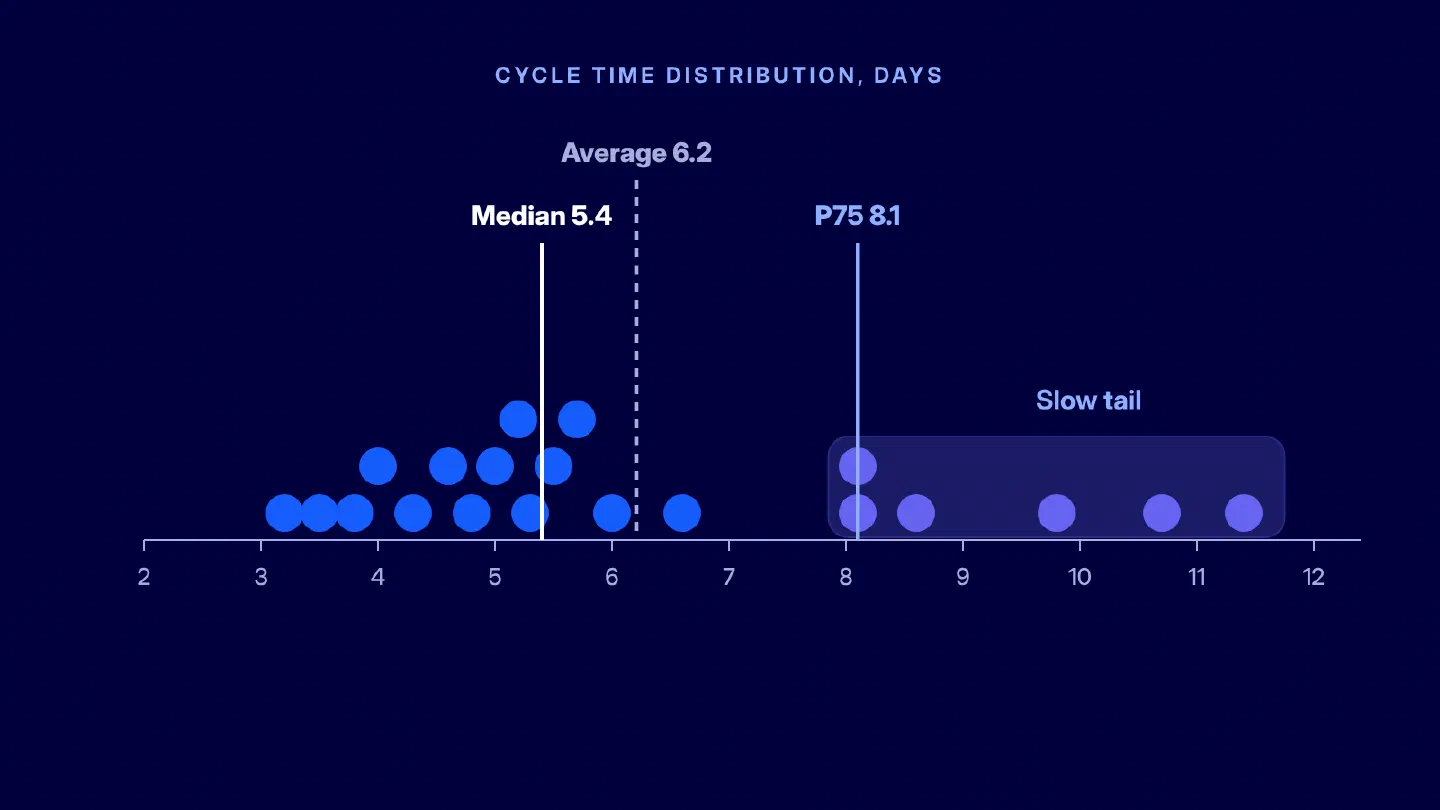
Engineering data rarely has a tidy bell curve. Ten routine changes can move through the system quickly while two dependency-heavy items stay open for weeks. An average compresses very different cases and can hide both the normal experience and the delivery risk.
Practical rule: for time-based engineering productivity metrics, report the median, P75 or P85, and the sample size.
For example, an eight-week cycle-time baseline might show a median of 5.4 days, P75 of 8.1 days, and an observed range of 3.2 to 11.4 days. A percentile based on six completed items should not carry the same confidence as one based on sixty.
5.3 Compare the New Period With the Baseline
Use the same definition, segments, and exclusions in both periods. The basic calculation is:
Percentage change = (current - baseline) / baseline x 100
| Metric | Baseline | After | Change |
|---|---|---|---|
| Cycle time | 5.4 days | 4.6 days | -15% |
| Review time | 1.3 days | 0.9 days | -31% |
| Throughput | 42 items/week | 45 items/week | +7% |
| Change failure rate | 6% | 11% | Worse by 5 percentage points |
Delivery is faster, but reliability is worse. That isn’t a clean productivity gain. Before declaring success, review the failure modes, the work mix, and the review-policy change.
For repeatable software engineering productivity measurement, record the following for every metric:
- the start and end event;
- exclusions;
- the aggregation method;
- segments;
- the owner;
- the review cadence;
- the investigation threshold.
Stable definitions matter more than a polished chart.
5.4 Use External Benchmarks Last
Developer productivity benchmarks should be used in this order:
- Your own historical baseline
- Comparable internal teams
- External benchmarks
Before using an external number, check:
- the metric definition;
- the cohort and operating environment;
- the work type and unit of analysis;
- whether the statistic is a median, P75, or P90;
- the sample size and measurement window.
A benchmark only means something when its method comes with it. If those details are missing, use the figure as a prompt for a question, not as a target. Developer productivity benchmarks aren’t a league table.
6. Special Case: How to Measure AI-Assisted Development
DORA’s 2025 research describes AI as an amplifier of what is already true in the organization. Dependable tests and available reviewers can turn AI assistance into faster feedback. Fragile tests or overloaded reviewers can simply feed more work into the same bottleneck.
Run the AI Experiment in Five Steps
- Define the baseline. Use four to eight weeks of comparable work and stable metric definitions.
- Define the cohort. Record the team, eligible work type, AI tool, and adoption period.
- Pick one primary outcome. Choose cycle time, review time, throughput, or another result tied to a decision.
- Add guardrails. Track rework, change failure rate, security findings, review demand, and developer experience.
- Decide whether to scale. Compare the outcome, guardrails, and cost, then scale, change, or stop.
| Measure | Example |
|---|---|
| Primary outcome | Cycle time |
| Quality guardrails | Change failure rate, rework, and review time |
| Experience | DevEx survey or structured team feedback |
| Cost | Licenses, enablement, and review overhead |
| Decision | Scale, change, or stop |
Here, measuring developer productivity means looking past adoption rates and generated-code volume. Pair software engineering productivity metrics with evidence on quality, experience, security, and cost. A 20% throughput lift isn’t an improvement when it also creates more failures or more review demand.
7. Put the Measurement System Into Practice
The first version of the system can be defined with six questions.
Ask These Six Questions
- What business outcome are we trying to improve?
- What management question needs an answer now?
- Which two to four metrics will help diagnose it?
- What is the local baseline?
- What change will trigger an investigation?
- What will management do if the metric moves?
As the team answers them, record the unit of analysis, data exclusions, owner, review cadence, and action rule. Those decisions keep an informal dashboard from turning into an ungoverned performance score.
Use a Simple 90-Day Rollout
Days 1 to 30: Define
- choose the management question and business outcome;
- select the metrics and document their definitions;
- map the available data and run a quality check.
Days 31 to 60: Baseline
- establish normal ranges and relevant percentiles;
- validate the interpretation with the team;
- separate real outliers from missing or inconsistent data.
Days 61 to 90: Improve
- change one named constraint;
- compare the new period with the baseline and quality guardrails;
- keep, revise, or retire each metric based on whether it supported a decision.
This keeps measuring engineering productivity tied to action without turning the effort into a large reporting program.
Common Measurement Mistakes
- Creating one productivity score. A single number hides trade-offs among flow, quality, experience, and business value.
- Ranking individual developers. Activity data changes with role, collaboration, task complexity, and work type.
- Reporting averages without distributions. The average can hide the slower tail and the work most likely to miss a commitment.
- Comparing unrelated teams. Different architectures, release models, and responsibilities produce different operating ranges.
- Changing definitions between periods. A trend is not credible when the start event, exclusions, or unit of analysis changed.
- Turning a benchmark into a target. External values rarely share the same cohort, workflow, and constraints.
- Treating AI usage as proof of productivity. Token spend, active AI users, and the share of AI-assisted work show adoption and cost, but they do not prove productivity gains. Interpret them alongside cycle time, throughput, review demand, rework, quality, and developer experience.
Lines of code, commits, pull requests, tickets closed, and hours online can describe part of a workflow. None of them should decide individual performance. These software developer productivity metrics become harmful once a diagnostic signal turns into a personal target. For a team measuring engineering productivity, fewer pull requests may mean larger initiatives, blocked dependencies, missing data, or deliberate investment in design.
Final Takeaway
Leaders assessing software delivery should begin with one decision, a small group of measures, a documented baseline, and a clear route to investigation. That is how to measure software developer productivity without mistaking activity for value. Benchmarks are context, not targets. Treat AI as a controlled use case. Above all, look at the system behind a metric before judging the team.
FAQ
What Are the Best Developer Productivity Metrics?
How Can Productivity Be Measured Without Surveillance or Individual Rankings?
How Do You Establish a Reliable Baseline?
What Is the Difference Between DORA and SPACE?
Should Companies Compare Teams With Public Benchmarks?
How Should AI-Era Developer Productivity Be Assessed?
Apply the Model to Your Own Engineering Structure
AndonPulse connects the metrics an organization already tracks with its initiatives, workflows, delivery risks, and resource context. Bring one live delivery question and see whether the model helps the team move from signal to cause, action, and measurable follow-up.