The company has 120 engineers working on 12 client projects. Each project has its own manager, its own board and, in practice, its own way of tracking status. For clients that’s fine. For the person responsible for delivery across all twelve, it was a lot of copying and pasting.
The challenge: a status report built by hand every week
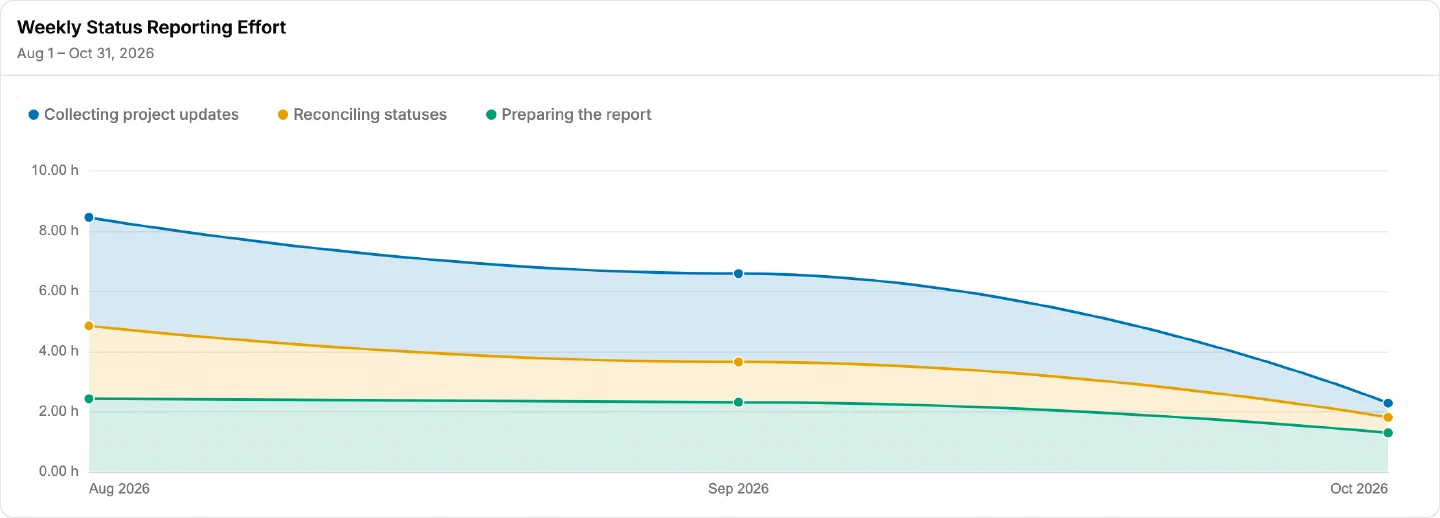
Every week the Delivery Director put together a report on all active projects. That meant opening twelve boards, a few spreadsheets, and messaging managers to fill gaps. Project managers spent their own time preparing updates for it. Altogether, the weekly report took around eight hours of manager time.
The report said what was late. It rarely said why. When a project slipped, the next step was another call with the project manager to dig into it, then often a second one once they had checked with the team. Getting to the real reason for a single delay could take a couple of hours.
In a services business that time has a direct cost. Managers who are busy explaining last week aren’t working on next week, and clients notice when answers take a day to arrive.
The setup: 12 projects, one structure
Getting started took two to three weeks. The company connected Jira and GitLab, then mapped projects, teams and workflow statuses to each other. That mapping was the real work, since different projects used slightly different statuses for the same thing. Once it was done, “in progress” or “blocked” meant the same thing across all twelve.
How the weekly review works now
The hand-built report was replaced by a shared project review. Everyone looks at the same picture of all projects, pulled from Jira and GitLab, so nobody has to collect it first.
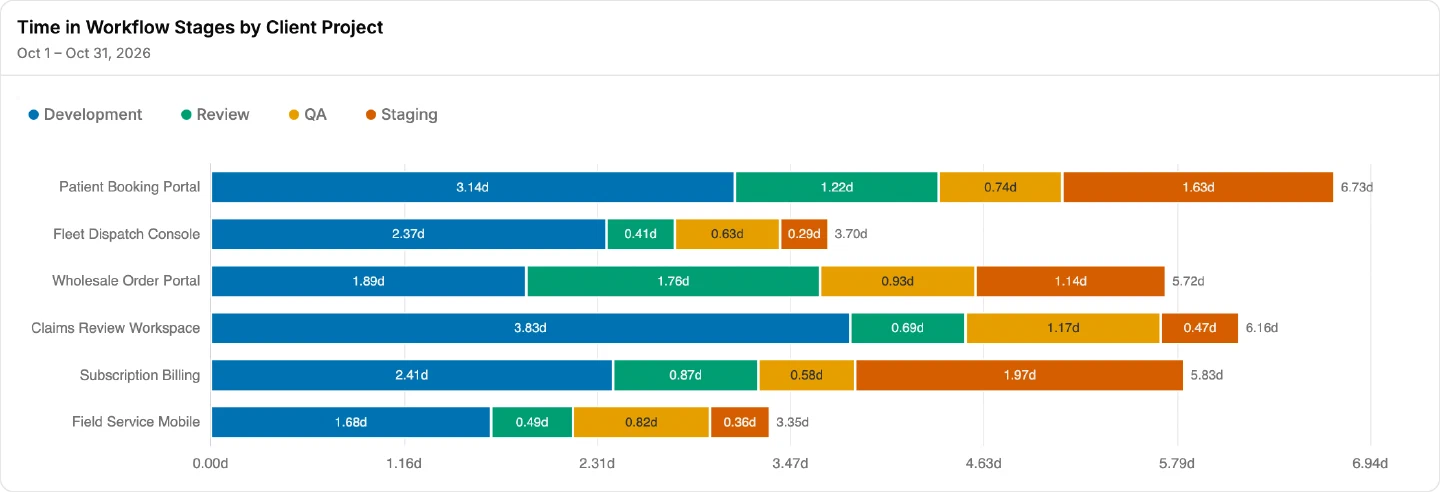
When a project is behind, the review goes down a level instead of into a separate meeting. From the initiative, the Delivery Director and project manager open the specific tasks that are late or stuck and see what is holding them: a long review, a blocked dependency, work that keeps bouncing back. Most of the time the answer is there in a few minutes.
Results after two months
Total manager time on the weekly status report: 8 → 2 hours, −75%. The data is already in one place, so the report is mostly reading, not collecting.
Typical time to find the cause of a delay: 2 hours → 30 minutes. Going from project to task replaces most of the follow-up calls.
Same picture for everyone. Project managers and delivery leadership look at the same numbers in the review.
| Metric | Before | After 2 months |
|---|---|---|
| Total manager time on the weekly status report | 8 hours | 2 hours |
| Typical time to find the cause of a delay | 2 hours | 30 minutes |
Time-to-value
Two to three weeks to connect and map the projects, and two months to the results above. The first shared review ran on real data as soon as the mapping was done.