- The team says
- We deploy all the time
- The data shows
- 22 of 104 weekly runs reach production
Every team counts its own way
One team counts every pipeline run, another counts releases, so the same metric means different things across teams.
AndonPulse is a DORA metrics platform that tracks all five DORA metrics by team and service, using your own definition of a deployment and a failure. Every change in a trend opens the deployments, pull requests and Issues behind it.
Scroll to see all five metrics
| Service | Change lead time | Team | Deploys / week | Recovery time | Change fail rate | Rework rate |
|---|---|---|---|---|---|---|
| payments-api | 4.1 d | Platform | 5 | 3.2 h | 8% | 6% |
| checkout-web | 2.2 d | Growth | 9 | 1.1 h | 4% | 3% |
| identity-service | 1.8 d | Identity | 4 | 0.9 h | 3% | 2% |
| search-api | 1.6 d | Discovery | 6 | 1.4 h | 5% | 4% |
| mobile-app | 2.4 d | Growth | 2 | 5.0 h | 6% | 5% |
| data-pipeline | 1.3 d | Data | 7 | 0.6 h | 2% | 2% |
| notifications | 1.5 d | Platform | 8 | 0.8 h | 3% | 2% |
| billing-service | 2.0 d | Payments | 3 | 2.1 h | 4% | 3% |
Read-only connections to the tools your teams already use
 Jira
 GitHub
 GitLab
 Linear
 Claude Code
 Cursor
 Codex
 BambooHR
The dashboard says lead time doubled. It doesn't say where the time went.
One team counts every pipeline run, another counts releases, so the same metric means different things across teams.
Failures sit in another tool and never get linked to the release behind them, so change fail rate looks better than it is.
The quarterly chart shows that lead time went up, but not which service, stage or pull requests made it slower.


Change lead time for payments-api went from 1.9 to 4.1 days in eight weeks. Deployment frequency stayed the same.
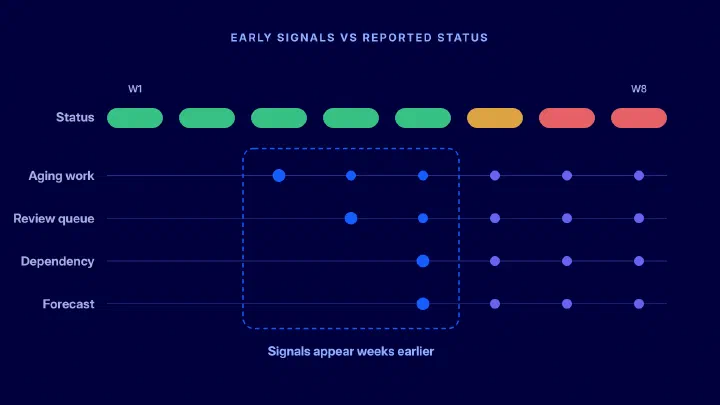
A change in the trend shows up before the quarterly review.
Only one of eight services moved. The other seven stay within their usual range.
Measured per service, because DORA metrics only make sense in context.
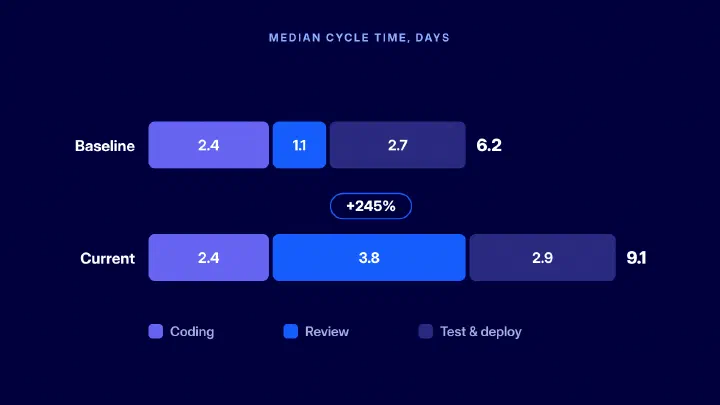
Most of the 4.1 days is waiting for a first review: 2.6 days. Coding and deployment take as long as before.
Stages come from pull request events, deployments and your own statuses.
Fourteen pull requests waited more than two days for a first review. Nine of them changed more than 600 lines.
Every number opens the pull requests and deployments behind it.
The team split large changes into smaller ones and agreed on a daily time for reviews. Six weeks later, change lead time was back to 2.2 days.
AndonPulse doesn’t make the decision. It shows where to act, and then whether the change worked.

A 40-engineer B2B SaaS team found that review waits drove its delivery time, and cut the median wait for a first review from 2 working days to 1 in four months.


Successful production deployments per day, week or month. Only the pipelines and environments you mark as production count.

From the first commit to the successful production deployment that ships it. Choose how to summarize lead time with the average, median, or a percentile such as P75 or P99.

From a deployment that needed intervention to the deployment or rollback that fixed it. Incidents not caused by a deployment are left out, so this is not a general MTTR.
The share of production deployments followed by a rollback, a hotfix or an incident linked to them.

The share of deployments made to fix a problem in production, such as hotfixes and patches, rather than to ship planned work.
DORA measures how the delivery system performs, not how productive a developer is or what a release is worth to the business. Read a trend in the context of its service, and treat a change as a signal to look into.
Most tools give you their definitions. AndonPulse uses yours. You decide which pipelines count as production, what counts as a failed deployment, and which services belong to which team. The DORA definitions stay standard.
Setup is guided: the AndonPulse team maps pipelines, services and failure rules with you and checks them on your data.
Connect your tools once. The same delivery model powers every view.
Engineering delivery
AI analytics
Planning & finance

Delivery speed and stability, with the deployments and pull requests behind each change.

Which sprint work is at risk before the review, and why it carried over.

Where reviews wait, and who carries the load.
Open this view
See how much of your work involves AI coding tools, by team.

Compare Cycle Time for work with and without AI assistance.

Follow how AI coding tools spread across teams over time.

Put the cost of AI tools next to what they change.

Where engineering capacity goes, compared with the plan.

Audit-ready R&D reports from measured work.
Open this viewNo new fields and no timesheets. Our customers saw first results in 2 to 4 weeks.
GitHub or GitLab, plus Jira or Linear, with read-only access.
Past deployments come in at once, so trends have a baseline from day one.
Production pipelines, services and failure rules, checked on your real data.
All five metrics by service, with the changes behind each trend.
The math is fully transparent — because we write the rules ourselves in the platform.
 Eugene Gusarov
Director of Product and Engineering, NetNation
AndonPulse reads deployments from your Git provider, links them to the pull requests and commits they ship, and links failures to the incidents and fixes that followed. The rules for what counts as production, a failure and a recovery are set with you and stay visible. Every number opens the deployments behind it.
Most DORA metrics software reads one source, so you see deployments but not the work behind them. A DORA metrics analytics platform should also show why a number moved. AndonPulse combines Git and pipeline data with Jira or Linear, so a slower lead time leads you to the stage, pull request and Issue that caused it. When you compare DORA metrics analytics solutions, ask to see how one deployment was counted on your own data.
No. DORA metrics is one view of the AndonPulse platform. It runs on the same connected data as cycle time, pull request analytics, sprint reports and delivery forecasts, so you connect your tools once.
Five. In 2024 DORA added deployment rework rate to the four classic metrics and grouped all five into throughput and instability. AndonPulse shows all five, so you can track the classic four keys and the newer metric side by side.
By service first, because a release process differs between a mobile app, a monolith and a set of services. AndonPulse maps each service to the team that owns it, so you can read the same metric at either level without mixing different release models.
No. DORA metrics describe how the delivery system performs, not how well a person works. You can open the pull requests behind a trend to find a review queue or an oversized change. AndonPulse has no developer leaderboards or individual scores.
Connecting your tools takes 5–15 minutes, and past data loads right away, so the trend has a baseline from day one. Mapping pipelines, services and failure rules with our team comes next. In our customer stories, teams had their first results within 2 to 4 weeks.
Request free access to AndonPulse. We’ll schedule a guided session and help you get from connected tools to useful insights.
A few details help us tailor the session to your tools and goals.
We’ll help you connect your tools, set up your workspace, and understand your data.
Use the free Developer Productivity plan for teams of up to 10, or try paid capabilities free for 14 days.
Connect your existing tools without changing your workflow.
We’ll email you to arrange a guided session before you receive access.