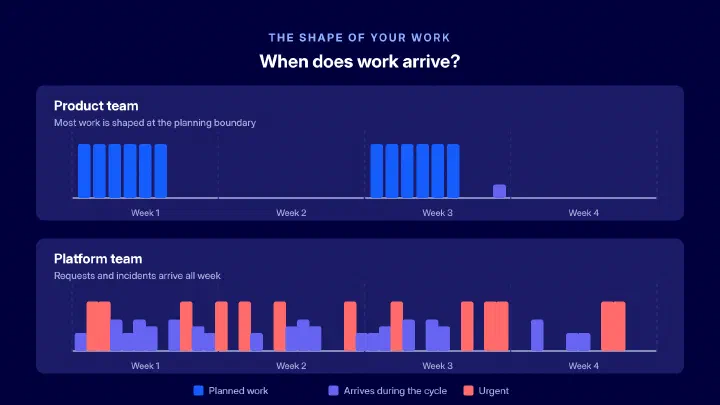
Status is assembled by hand
Someone pulls Jira, Git and Slack threads into a slide, and it is out of date by Friday.
AndonPulse connects Jira, GitHub, GitLab and Linear into one live view of every initiative. It flags delivery risk early and takes you to the Issue, stage and rule behind it.
8 of 14 Deliverables
On track Growth team
Checkout redesign
61 of 64 Issues done
Scope is stable and progress is steady.
At risk Platform team
Payments API v2
38 of 70 Issues done
Nine pull requests wait on two reviewers.
Open the work behind itOn track Growth team
Mobile onboarding
29 of 38 Issues done
No stage is slower than usual for this team.
Watch Data team
Data export
28 of 44 Issues done
Two Issues wait for Payments API v2.
On track Identity team
SSO for admins
28 of 31 Issues done
QA is in progress.
On track Discovery team
Search relevance
31 of 52 Issues done
Scope is stable.
On track Billing team
Billing migration
22 of 80 Issues done
Progress matches the plan.
On track Identity team
Audit log
21 of 26 Issues done
Review wait is normal.
Read-only connections to the tools your teams already use
 Jira
 GitHub
 GitLab
 Linear
 Claude Code
 Cursor
 Codex
 BambooHR
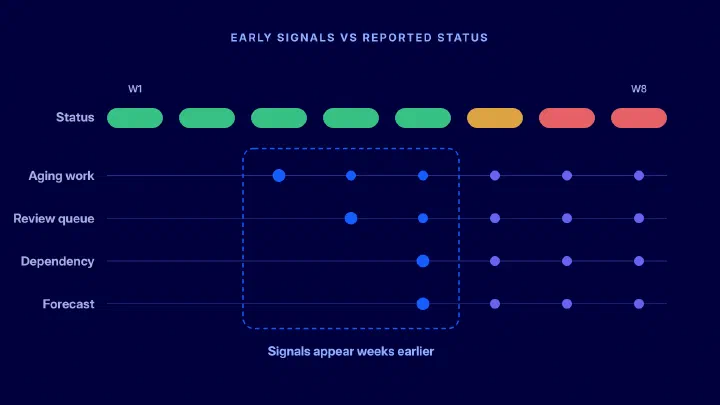
The status report says on track. The work under it says something else.
Someone pulls Jira, Git and Slack threads into a slide, and it is out of date by Friday.

A green status says little about the work under it, so the slip appears when the date passes.

Work sits in review, in QA or in another team's queue, and no report shows which stage holds it.


Two of 14 Deliverables are flagged this week. Payments API v2 moved the most.
Flagged from real progress, not from a status someone typed.
The forecast for Payments API v2 moved from Dec 12 to Dec 26. Scope grew by six Issues, and progress slowed over the last two weeks.
The forecast comes from completed work so far and the scope that is left.
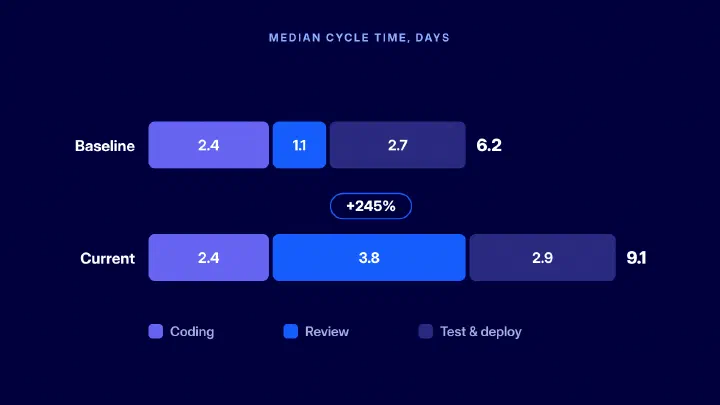
Most of the delay sits in one stage. Pull requests wait 3.4 days for a first review, up from 1.1 days a month ago.
Stages come from your own statuses.
Nine open pull requests wait on two reviewers from the Platform team. The other teams are on schedule.
A review bottleneck in one team, not a slow initiative.
Add reviewers from another team, cut scope, or move the date with evidence stakeholders can check.
AndonPulse doesn't make the decision. It shortens the way to an informed one.
Every initiative across every team in one live view, with risky ones flagged automatically.
A 120-engineer custom development company cut its weekly status report from 8 to 2 hours in two months.

AndonPulse forecasts the finish date from real progress, so you see the risk before the deadline passes.
An 80-engineer online retailer raised releases on the agreed date from 60% to 80% in four months.
Effort and cost by initiative, team and type of work, from the same data. Finance gets numbers it can trace.
The same data feeds software capitalization reports, so nobody runs a separate time tracker.

Which initiatives need my attention this week, and what do I tell the CEO?
Start from risks and forecasts, then open the evidence. Share a link instead of a slide.

Will this ship on the agreed date, and what changed since last week?
The forecast, the scope added since planning, and the blockers. Engineering and product read the same forecast.

Where is work waiting in my team: review, QA or another team?
Time in each workflow stage, down to the Issue and the pull request. A growing queue shows up before the sprint review.

What is waiting on my review, and what is blocking my work?
See the review queue and blocked work for your team, so the process gets fixed instead of the people.

AndonPulse shows how work flows, not how good an engineer is. There are no developer leaderboards or individual scores.
Most tools give you their definitions. AndonPulse uses yours. You decide which statuses mean active and which mean waiting, and every metric follows.
Try it. Change a status on the right and watch the metric move.
PAY-437 · Webhook retries · 17 days
Flow efficiency
Change a rule and past periods recalculate, so trends stay comparable.
Connect your tools once. The same delivery model powers every view.
Engineering delivery
AI analytics
Planning & finance


Every initiative, its forecast, and the work behind it.

Delivery speed and stability, with the deployments and pull requests behind each change.
Open this view
Which sprint work is at risk before the review, and why it carried over.
Open this view
Where reviews wait, and who carries the load.
Open this view
See how much of your work involves AI coding tools, by team.
Open this view
Compare Cycle Time for work with and without AI assistance.
Open this view
Follow how AI coding tools spread across teams over time.
Open this view
Put the cost of AI tools next to what they change.
Open this view
Where engineering capacity goes, compared with the plan.
Open this view
Audit-ready R&D reports from measured work.
Open this viewNo new fields and no timesheets. Our customers saw first results in 2 to 4 weeks.
Jira, GitHub, GitLab, Linear, your AI coding tools and your HR system, with read-only access.
Past months come in at once, so trends have a baseline from day one.
Initiatives, teams and statuses, checked on your real data.
Every initiative with its forecast and flags, checked against what your managers know.
The math is fully transparent — because we write the rules ourselves in the platform.
 Eugene Gusarov
Director of Product and Engineering, NetNation
AndonPulse reads status changes, issue links and pull request events from your tools and forecasts each initiative’s finish date from the progress made so far. An initiative is flagged when its forecast passes the planned date, or when work sits in one stage much longer than usual for that team. Every flag opens the tasks and stages behind it, with the time each task spent in every workflow stage, so you can check why it fired. A forecast is built on progress so far. It can’t see a decision that hasn’t reached the tracker yet, so the date moves as soon as the work does.
Project management software for engineering tracks tasks, owners and plans. An engineering management platform reads that data together with Git activity and shows how the work is actually moving. AndonPulse adds forecasts, early risk flags and time in each workflow stage across all teams. Jira stays where your teams plan and work, and AndonPulse doesn’t add fields or steps to it.
No. AndonPulse is one software engineering management platform. The delivery overview, DORA metrics, sprint reports, resource allocation and capitalization reports all run on the same connected data. You connect your tools once, and every view uses the same rules for statuses, teams and initiatives. A delay flagged in the delivery overview opens the same tasks you see in cycle time and sprint reports.
Yes. Each team can keep its own statuses, issue types and board setup. You map them once to shared stages and initiatives, for all teams or team by team. The AndonPulse team does this with you during guided setup and checks the result on your real data before you rely on the numbers.
No. AndonPulse is built to show where work waits in the process, such as a review queue, a blocked dependency or an overloaded team. You can drill down to a task or a contributor to find the cause. Contributor data gives context to a process decision, such as who needs help with reviews. There are no leaderboards or individual productivity scores.
Connecting your tools takes 5–15 minutes, and larger accounts take longer. Historical data loads right away, so you see trends without months of waiting. Mapping your delivery model with our team usually comes next. In our customer stories, teams had their first insights or reports within 2 to 4 weeks. Nobody has to change their workflow for it.
Integrations are read-only, so AndonPulse never changes your boards or repositories. Each customer’s data is stored in a separate database and protected with SSL/TLS and encryption of sensitive fields. AndonPulse follows SOC 2 and GDPR best practices. It reads metadata such as statuses, timestamps and pull request events, not your source code. The Trust Center has the details. If you want to look around first, you can ask for a sandbox account that doesn’t need your data.
Request free access to AndonPulse. We’ll schedule a guided session and help you get from connected tools to useful insights.
A few details help us tailor the session to your tools and goals.
We’ll help you connect your tools, set up your workspace, and understand your data.
Use the free Developer Productivity plan for teams of up to 10, or try paid capabilities free for 14 days.
Connect your existing tools without changing your workflow.
We’ll email you to arrange a guided session before you receive access.