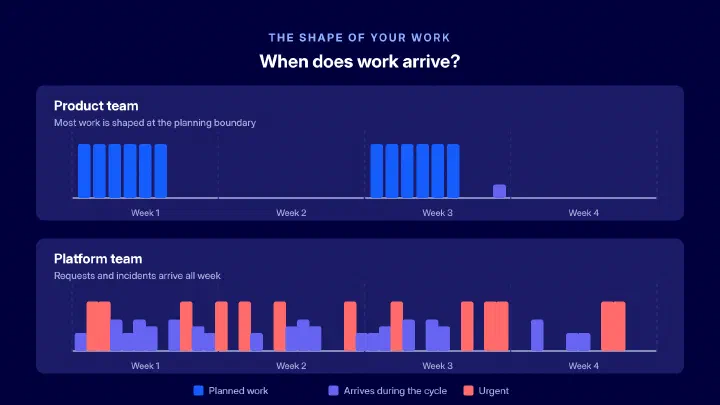
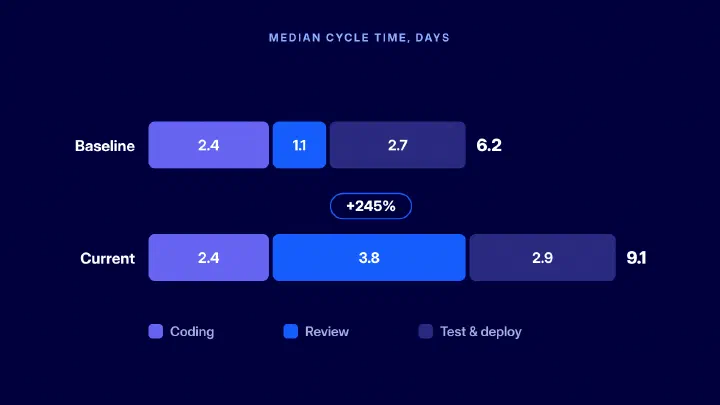
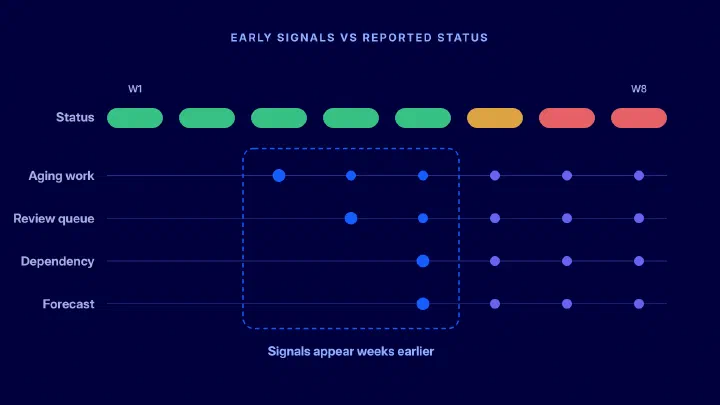
- The team says
- Review is a bit slow
- The data shows
- 22 pull requests wait for review
The queue is invisible
Open pull requests sit across dozens of repositories, and nobody sees the total until a release slips.
AndonPulse splits review time into stages, shows where the queue forms by repository, team and reviewer, and links each waiting pull request to the work it blocks.

Read-only connections to the tools your teams already use
 Jira
 GitHub
 GitLab
 Linear
 Claude Code
 Cursor
 Codex
 BambooHR
Git hosts show pull requests one repository at a time. The review flow across your teams stays out of sight.
Open pull requests sit across dozens of repositories, and nobody sees the total until a release slips.
Requests go to the people who know the code best, so a handful of engineers end up reviewing for everyone.
Cycle time mixes coding, waiting and review, so you can't tell which part of the work got slower.


Median review time in the Platform team, from opened to merged, went from 2.1 to 4.8 days in ten weeks.
A change in the trend shows up before the sprint review.
Most of the 4.8 days is pickup time: 3.7 days. Review time and merge time are close to the other teams.
Stages come from pull request events and your own statuses.
Two repositories hold most of the pickup time: platform-gateway at 5.2 days and auth-service at 4.4 days.
Group repositories by team, product or Deliverable.
Two Platform reviewers did 61% of first reviews in August. Pull requests waited for them.
A review load problem, not slow engineers.
The team made two Payments engineers code owners of platform-gateway and auth-service, and agreed on a daily time for reviews. Six weeks later, median review time was 1.8 days, down from 4.8.
AndonPulse doesn't make the decision. It shows where to act, and then whether the change worked.
A 40-engineer B2B SaaS team cut median pickup time from 2 working days to 1. Read the story

In the B2B SaaS story, most of the waiting traced back to a few reviewers who covered several repositories.

The same data feeds cycle time, sprint reports and delivery forecasts, with no second setup.

AndonPulse reads the events of every pull request in GitHub or GitLab and splits its time into three stages.
platform-gateway #1482 · Retry failed webhooks
Ready for review to merge: 3 d 18 h. Point at a stage to see where it starts and ends.
Connect your tools once. The same delivery model powers every view.
Engineering delivery
AI analytics
Planning & finance

Delivery speed and stability, with the deployments and pull requests behind each change.

Which sprint work is at risk before the review, and why it carried over.

Where reviews wait, and who carries the load.

See how much of your work involves AI coding tools, by team.

Compare Cycle Time for work with and without AI assistance.

Follow how AI coding tools spread across teams over time.

Put the cost of AI tools next to what they change.

Where engineering capacity goes, compared with the plan.

Audit-ready R&D reports from measured work.
Open this viewNo new fields and no timesheets. Our customers saw first results in 2 to 4 weeks.
GitHub or GitLab, plus Jira or Linear, with read-only access.
Past months come in at once, so you have a baseline before you change anything.
Teams, repositories and review statuses, checked on your real data.
Pickup time, review time and merge time for every team, with the slowest pull requests on top.
The math is fully transparent — because we write the rules ourselves in the platform.
 Eugene Gusarov
Director of Product and Engineering, NetNation
Pickup time runs from the moment a pull request is ready for review to its first review. Review time runs from the first review to approval. Merge time runs from approval to merge. You choose how each chart calculates them: the median, the average or any percentile. Every number opens the pull requests behind it, so you can check how it was counted.
GitHub and GitLab show pull request activity one repository at a time. AndonPulse combines review data from all repositories with Jira or Linear. It splits the time into stages, shows the review load for each team and reviewer, and links each pull request to the Issue and Deliverable it holds up.
No. Pull request analytics is one view of the AndonPulse platform. It runs on the same connected data as cycle time, DORA metrics, sprint reports and delivery forecasts. A slow review queue you find here shows up in the forecast of the Deliverable it holds up, without a second setup.
No. AndonPulse reads pull request metadata, such as timestamps, reviewers and status, not the code itself. Integrations are read-only, and each customer’s data sits in a separate database with SSL/TLS and encryption of sensitive fields. The Trust Center has the details.
No. Reviewer views show how the review load is spread, so you can share it more evenly. In the B2B SaaS story, the slow reviews came from a few people doing everyone’s reviews, not from slow engineers. There are no leaderboards or individual productivity scores.
Yes. You configure every dashboard, so you choose which accounts count as bots and whether their pull requests and reviews count. You can change the rules at any time, and past periods recalculate.
Request free access to AndonPulse. We’ll schedule a guided session and help you get from connected tools to useful insights.
A few details help us tailor the session to your tools and goals.
We’ll help you connect your tools, set up your workspace, and understand your data.
Use the free Developer Productivity plan for teams of up to 10, or try paid capabilities free for 14 days.
Connect your existing tools without changing your workflow.
We’ll email you to arrange a guided session before you receive access.