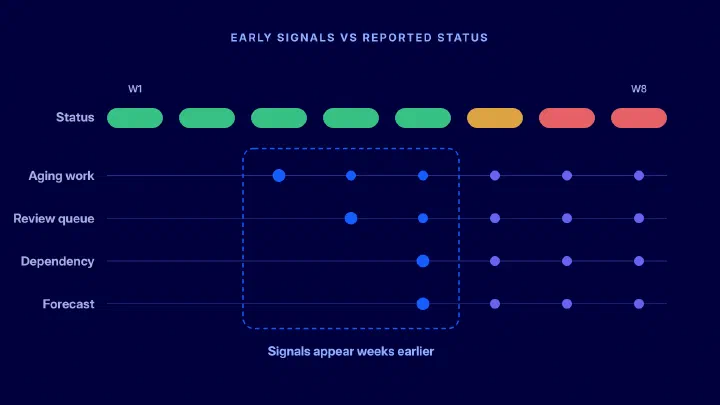
- The team says
- We’re still on the original scope
- The data shows
- 6 added, 2 removed
Scope moves after planning
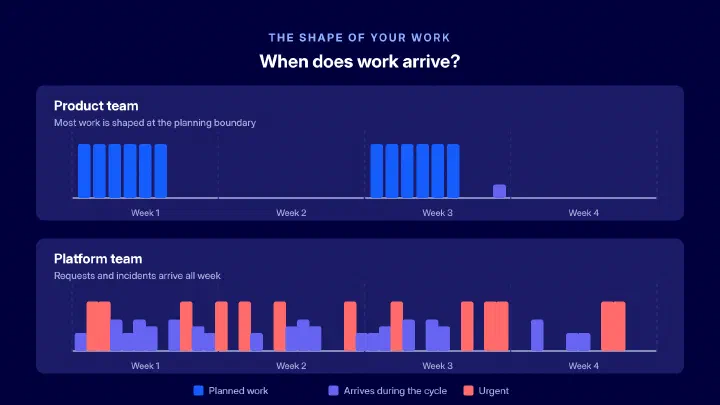
Work added mid-sprint blends into the original plan, so the completion rate looks fine while the Sprint Goal slips.
AndonPulse is sprint analytics software that puts commitment, scope changes and carryover next to the pull requests and reviews behind them. You see the risk while the sprint is still running.

Read-only connections to the tools your teams already use
 Jira
 GitHub
 GitLab
 Linear
 Claude Code
 Cursor
 Codex
 BambooHR
The burndown looks fine in the middle of the sprint. The carryover shows up at the retrospective.
Work added mid-sprint blends into the original plan, so the completion rate looks fine while the Sprint Goal slips.
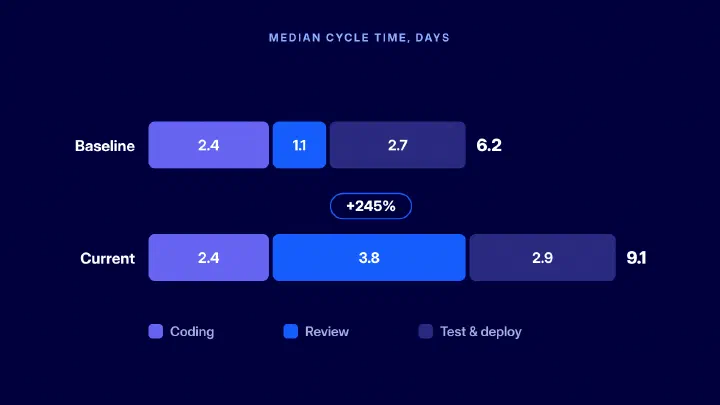
An Issue stays In Progress while its pull request waits for a reviewer. Jira doesn’t read Git, so the delay surfaces in the last days.
Work waits on another team for a week and nobody flags it, so the reason for carryover is found only after the sprint is over.


On day 7 of 10, Sprint 46 is likely to finish 27 to 30 of its 38 Issues. Completed work is falling behind the scope, which grew after planning. A risk shows up mid-sprint, while there is still time to act.
The team committed to 34 Issues. Six more were added after the start and two were removed. The change history shows which Issues moved in or out and when, so the team can see what displaced planned work.
Sort open Issues by time in their current status. Three are In Progress, but their pull requests have waited 3 to 4 days for a first review. One has been blocked by another team for six days.
This sprint, open Issues waited 2.4 days on average for a first review, four times longer than in the last three sprints. Two of the team’s three regular reviewers spent the week on a release. Stages combine your Jira statuses with pull request events.
The team set a daily review slot and moved the two Issues added last to the next sprint. Over the next three sprints, carryover went from 9 Issues to 3. AndonPulse doesn’t make the decision. It shows where to act, and then whether the change worked.

An 80-engineer e-commerce team that started tracking blocked work in AndonPulse cut the median time a task stays blocked on another team from 5 working days to 3.


Issues in the sprint at the moment it starts. Your team can set a short grace period after the start, so late planning changes don’t count as scope added.
Issues added to or removed from the sprint after the start, with the day each change happened. Removed Issues are shown separately and never count as done.

Issues that reached your done status by the sprint end, split into committed and added work. The sprint end is the cutoff for both groups.

Issues not done by the sprint end, whether they move to the next sprint or go back to the backlog. Cancelled Issues are left out. Each one shows its last status, blocked time and pull request state.
The number of Issues likely to be done by the sprint end, shown as a range, such as 27–30 of 38. It is based on the team’s pace in past sprints and the age of open work.
What it doesn’t tell you. Velocity and completion rate are planning aids for one team. They don’t measure how productive a team or a person is, and they can’t compare teams with different workflows. Read them against the team’s own history.
Most sprint reports apply one set of rules to every team. AndonPulse uses yours. You decide when the sprint scope is fixed, which status means done, how subtasks count and which work is unplanned. Each team keeps its own workflow and sprint length.
Try it. Change a rule on the right and watch the numbers move.
Setup is guided: the AndonPulse team maps sprint fields, statuses, Issue types and teams with you and checks them on your data.
How Sprint 45 is counted · Platform team
Planning grace period: 1 day
Issues added on day 1 count as committed
"Ready for release" counts as done
The status before deployment closes the Issue
Count subtasks separately
Each subtask counts as its own Issue
Change a rule and past sprints recalculate, so trends stay comparable.
Connect your tools once. The same delivery model powers every view.
Engineering delivery
AI analytics
Planning & finance

Delivery speed and stability, with the deployments and pull requests behind each change.
Open this view
Which sprint work is at risk before the review, and why it carried over.

Where reviews wait, and who carries the load.
Open this view
See how much of your work involves AI coding tools, by team.

Compare Cycle Time for work with and without AI assistance.

Follow how AI coding tools spread across teams over time.

Put the cost of AI tools next to what they change.

Where engineering capacity goes, compared with the plan.

Audit-ready R&D reports from measured work.
Open this viewNo new fields and no timesheets. Our customers saw first results in 2 to 4 weeks.
Connect Jira and GitHub or GitLab, with read-only access. Linear calls its iterations Cycles, and its AndonPulse integration is coming soon.
Past sprints come in at once, so each team has a baseline from day one.
Sprint fields, statuses, Issue types and teams, checked on your real data.
Commitment, scope change and carryover, with the work behind each number.
The math is fully transparent — because we write the rules ourselves in the platform.
 Eugene Gusarov
Director of Product and Engineering, NetNation
Sprint analytics software reads sprint data from Jira or Linear and shows how each sprint went: what the team committed to, what changed, what was finished and what carried over. Good sprint reporting and analytics also explains why. AndonPulse adds the pull requests and reviews behind each Issue, so a slow sprint leads you to the review queue, blocker or scope change behind it. When you choose a sprint reporting and analytics program, check that it explains carryover as well as counting it.
Committed work is what is in the sprint when it starts. Added and removed work is anything that moves in or out after that. Completed work reached your done status by the sprint end, and carried-over work did not. The exact rules, such as which status means done, are set with you and stay visible next to every number.
AndonPulse reads the history of each Issue, so it knows when work entered or left the sprint. The sprint analytics dashboard shows scope day by day, so you can see whether a change came on day 2 or in the last days of the sprint.
No. Velocity is a planning aid for one team. Story points differ between teams, and turning them into a target invites gaming. AndonPulse shows velocity against the team’s own history and has no team or developer leaderboards.
Yes. AndonPulse links Issues to the branches, commits and pull requests that mention them in GitHub or GitLab. That is how an Issue that looks In Progress on the board shows a pull request waiting for its first review.
It compares the age of each open Issue with how long work usually stays in that status for this team, and checks blocked time and linked pull requests. Issues that are older than usual, blocked or waiting for review are flagged while there is still time to act.
Yes. Each team keeps its own statuses, sprint length and done rule, and the AndonPulse team maps them with you during setup. Connecting your tools takes 5–15 minutes. In our customer stories, teams had their first results within 2 to 4 weeks.
Request free access to AndonPulse. We’ll schedule a guided session and help you get from connected tools to useful insights.
A few details help us tailor the session to your tools and goals.
We’ll help you connect your tools, set up your workspace, and understand your data.
Use the free Developer Productivity plan for teams of up to 10, or try paid capabilities free for 14 days.
Connect your existing tools without changing your workflow.
We’ll email you to arrange a guided session before you receive access.